
The news flows surrounding the US-China trade narrative since Friday can only be characterized as in a state of Yo-Yo type dynamics. Trump threw cold water to the prospects of an interim trade deal in Oct while the Chinese Commerce Ministry keeps the hopes alive describing talks as 'constructive'. The risk environment is more constructive again even if what's unfolded since Friday is a clear warning...
Quick Take
There has been a change of dynamics at the open of markets in Asia, with risk being bid again as signs of progress in trade discussions between the US and China were highlighted by the Chinese Commerce Ministry over the weekend. The usual suspects when optimism arises, that is, the AUD, NZD were bought back, with sell-side pressure applied to, most notably, the JPY and CHF. The CAD remains with a relatively stable outlook with the Oil up-gap this Monday to potentially act as a bullish contributor today. The USD is holding its ground quite firm with technicals in favor for further gains. The EUR keeps struggling at a supply area in its index, as I elaborate in today's chart analysis, while the GBP saw a setback in the last 24h as reports emerge that the UK and EU are as far from an agreement to replace the backstop as ever. Today's key highlights to act as an extra stimulus of price gyrations include EU/US PMIs and ECB's Draghi testimony in the EU parliament.
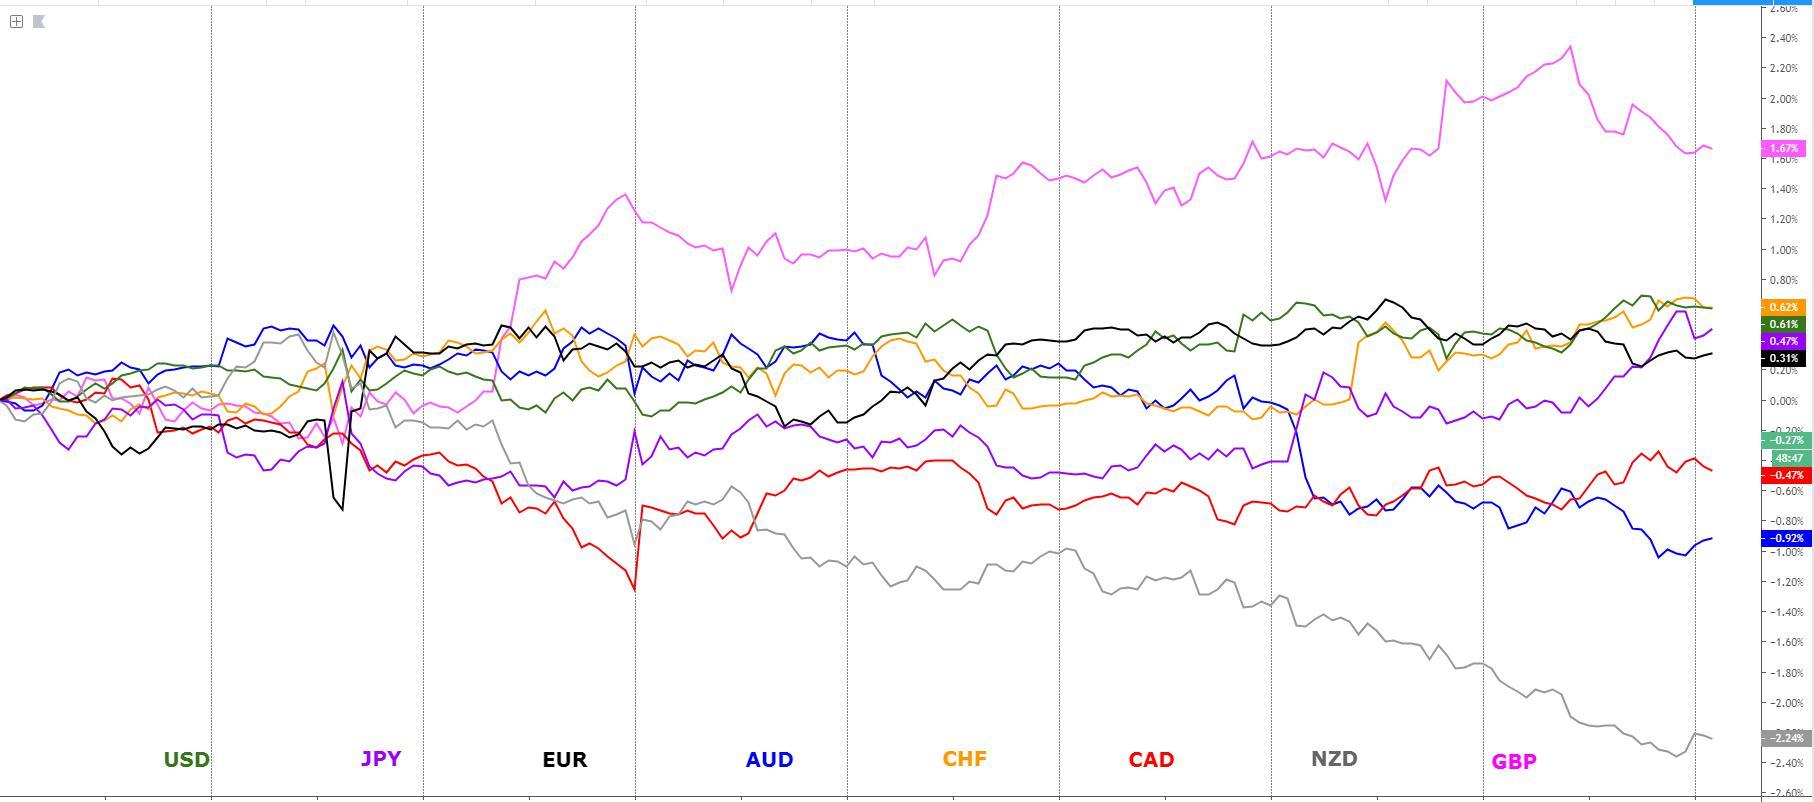
The indices show the performance of a particular currency vs G8 FX. An educational article about how to build your own currency meter can be found in the Global Prime's Research section.
Narratives In Financial Markets
* The Information is gathered after scanning top publications including the FT, WSJ, Reuters, Bloomberg, ForexLive, Institutional Bank Research reports.
Trump throws cold water in the optimism built around trade talks: US President Trump deflates some of the optimism about a partial trade deal with China in October by saying that the US is not keen on a half-baked trade agreement at this point, leading to an abrupt last minute cancellation to visit US farmers by a Chinese delegation, which was seen as a continuation of the gestures of goodwill both countries had vowed to abide by.
Interim US-China trade agreement less likely in October? Trump The US President stressed that “I am not looking for a partial deal. I am looking for a complete deal”, which obviously suggests that the chances for an interim agreement in October looks less likely. Even as Trump highlighted his relationship with Chinese President Xi as “amazing”, he went on to say that at present they are having “a little spat”, adding that “I think the voters understand that…I don’t think it has any impact on the election.”
But on the bright side, constructive talks continue... Another report over the weekend by the NY Times notes that despite the remarks by Trump, “both sides moved on Saturday to indicate that the negotiations continue.” According to China's state-run Xinhua news agency, cited by the NYT, “fairly senior negotiators had conducted constructive discussions in Washington in recent days and had agreed to continue to maintain communication.” The Xinhua statement, the NYT notes, “was matched by a separate statement from the United States trade representative in Washington that discussions were productive, and the United States looks forward to welcoming a delegation from China for principal-level meetings in October.”
RORO profile back and forth: Risk assets came off the the daily highs in a heartbeat last Friday as the market prices out a successful resolution to the upcoming trade talks expected in early October. It appears as though contentious issues such as intellectual property rights remain the main blockage. The upside breakouts in the JPY index, gold or bonds is a worrying sign to be monitored closely. As a new week begins, it seems as though the market is regaining some of the lost optimism after the Xinhua report.
Oil opens with gains after Aramco's headlines: The price of Oil has jumped over $1 at the open of markets in Asian after headlines over the weekend by Saudi Arabia’s state-owned Oil conglomerate Aramco, noting that the current repairs to Saudi Oil plants “could take many months rather than weeks”, the DJ wrote. The report adds that “it may take many months-rather than the maximum 10 weeks company executives have promised-to restore operations to full working order.” The longer it takes, the more bullish it is for Oil all else equal as the disruption in Oil supply extends in time.
Johnson's proposals thought to be a waste of time: According to a report by ITV Journalist Rebort Peston, which did make the rounds on Friday, Johnson's proposals on the Irish border is seen by Brussels as "an utter waste of time". The news led to a sharp retreat in the Sterling on Friday. The report notes: "It is crystal clear UK and EU are as far from agreement to replace backstop as ever. Multiple sources tell me that Johnson's 'non paper' proposals to keep open border on Ireland are seen in Brussels and EU capitals as an utter waste of time, and that Johnson is as far away as ever from what the EU regards as a possible 'landing zone'. There will be one last push, one last chance, after Tory conference. But till then it is full steam ahead with no deal preparations on both sides."
Fed's Clarida highlight each meeting live from here on out: A line up of Fed speakers made comments on monetary policy last Friday, including Fed’s Vice Chairman Clarida, which for what’s worth, made no remarks that helps the market learn anything new about the Fed’s stance. If anything, it reinforces the message from Chair Powell in that every meeting from here on out will be live within the context of a neutral policy as the lay of the land stands right now but with rapid adaptation to changes in the outlook. Clarida noted “the center of gravity on the committee is the second adjustment was appropriate. Going into October and beyond, we’ll go one meeting at a time.”
Fed's Bullard sticks to his dovish guns: Fed’s Bullard, who is a well-known dovish member, kept endorsing further easing in Friday’s remarks by saying that “It is prudent risk management, in my view, to cut the policy rate aggressively now and then later increase it should the downside risks not materialize. At the same time, a 50 basis point cut at this time would help promote a more rapid return of inflation and inflation expectations to target.”
Boston's Rosengren remains a committed hawk: Boston Fed President Rosengren, who has been supporting the hawkish policies and has been a dissenter in the last two rate cuts, said that his last decision to not endorse a rate cut was due to minimizing “the risk of further inflating the prices of risky assets and encouraging households and firms to take on too much leverage”. He argued that the data in the US suggests the economy is in an overall healthy state despite shocks.
Fed's Kaplan still concerned about spillover effects: Fed's Dallas President Kaplan said he doesn't see another cut this year but is open minded, even if he maintains a residual dovish tilt to his tone by noting that he's not opposed to cuts and that he still project one more will be needed next year. But again, he made his comments sound very conditional to the current dicey dynamics in the market by stressing that “is watching how trade tensions unfold, doesn't want to prejudge.” Kaplan kept reiterating that manufacturing is weak and business investment soft, which should be a reason to be concerned as he fears may spill onto other areas of the economy.
Canadian retail sales shrugged off by CAD bulls: Canada’s July retail sales came softer at +0.4% vs +0.6% expected. The outcome is rather poor based on what economists were calling for. Sales were up in 6 of 11 subsectors. The Canadian Dollar did end up the Friday rather strong nonetheless, with Monday’s open valuation firming up a tiny bit assisted by the upside gap in the price of Oil.
EU/US PMIs & Draghi up next: Monday's events highlights include EU and US Sept PMIs with the median projections skewed towards a minor rebound in the manufacturing sectors. Besides, more Fed speakers will be on duty to update their views on policy, including William, Bullard and Daly. Draghi also takes center stage as he is due to testify to the European Parliament where he is expected to emphasize the much needed collaboration between monetary and fiscal policies while reasserting his view of QE as a necessary tool to keep the EU afloat.
NZIER’s Shadow Board divided on where OCR should be: The New Zealand Institute of Economic Research (NZIER) Monetary Policy Shadow Board, which is an independent body of the Reserve Bank of New Zealand, notes that “there has been increased divergence in views amongst the NZIER Monetary Policy Shadow Board on what the OCR should be at the OCR Review this Wednesday. This widening in the range of views follows the Reserve Bank’s surprise decision to cut the OCR by 50 basis points at its August meeting. Although Shadow Board members generally called for keeping the OCR on hold, some saw a higher OCR as appropriate. The views were taken before the release of June quarter GDP.”
Recent Economic Indicators & Events Ahead
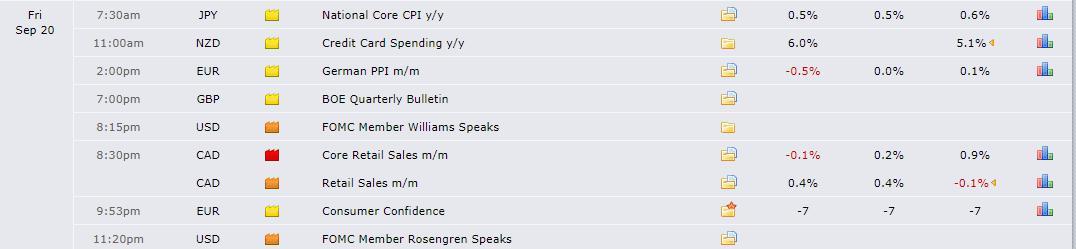
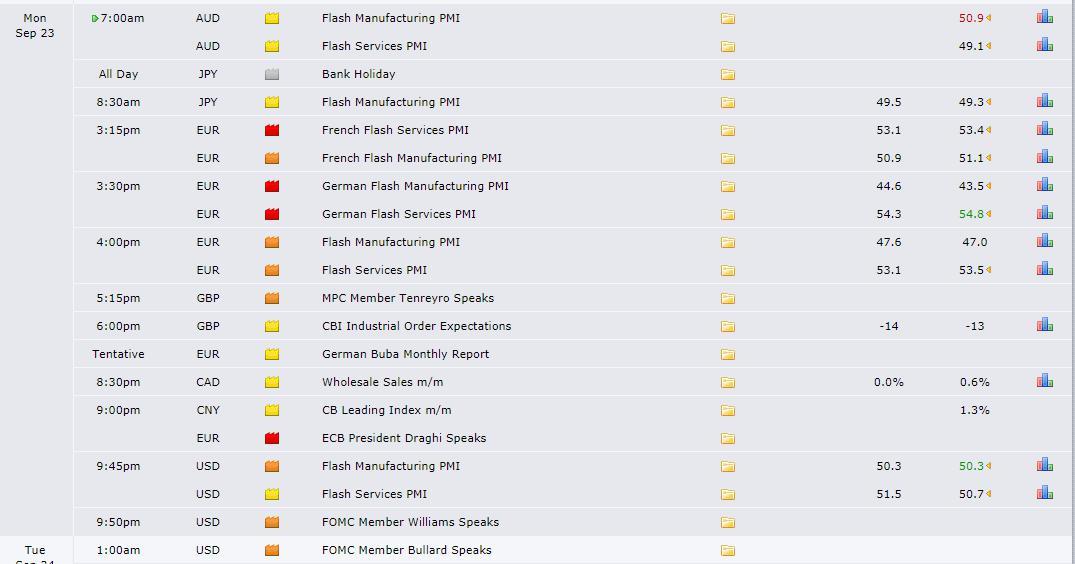
Source: Forexfactory
A Dive Into The Charts
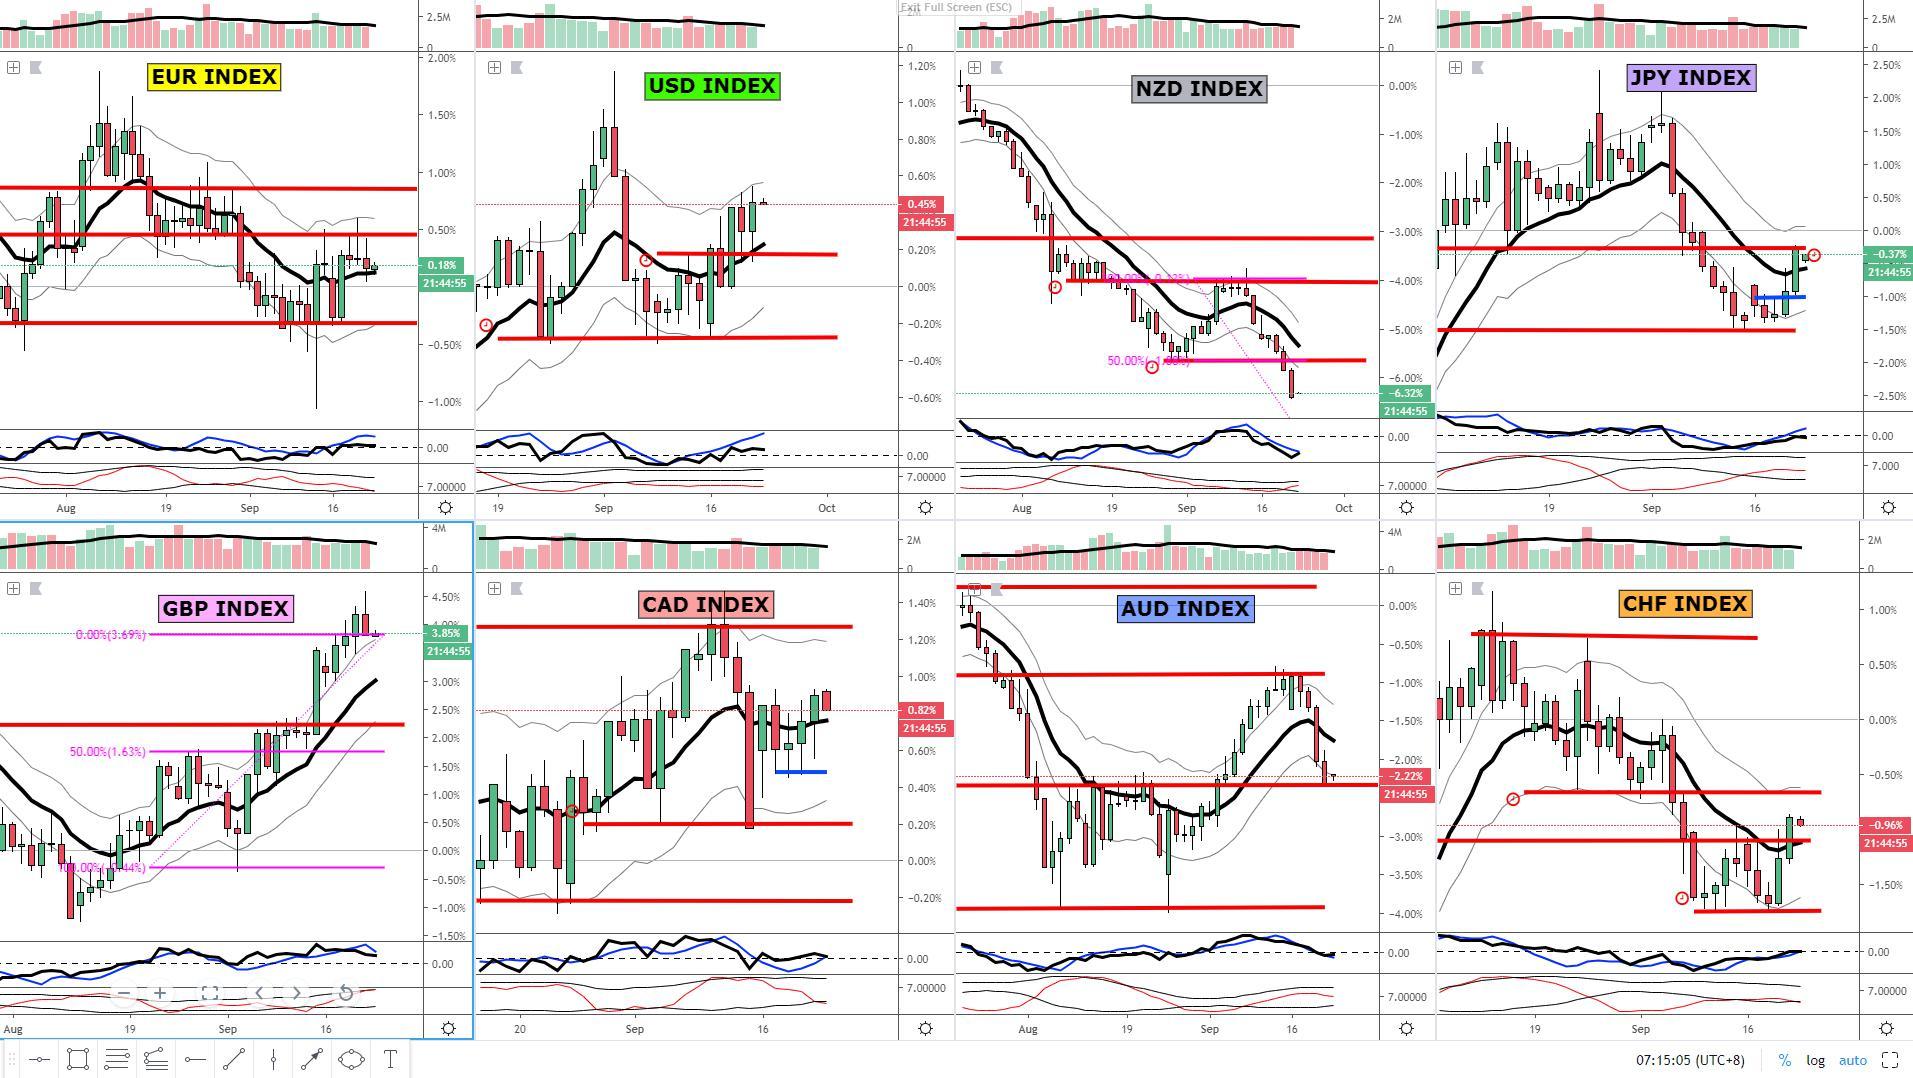
The indices show the performance of a particular currency vs G8 FX. An educational article about how to build your own currency meter can be found in the Global Prime's Research section.
The EUR index ascendancy keeps being challenged by the multitude of offers sitting overhead at a critical resistance on the daily as depicted by the red line. Every single time the EUR makes it into this area of resistance, traders should be on alert for potential sell-side opportunities as EUR selling flows tend to overwhelm, which is well justified from a technical standpoint, as the index keeps revisiting the most notorious supply imbalance area originated in Aug 30th. The back-to-back upper shadow candles on the daily manifests quite clearly this oversupply at the top, with risk of a downside acceleration once the baseline (currently tested) is taken out.
The GBP index has finally seen a setback from its hefty level, currently testing the violated 100% proj target from last week. The altitude in the GBP valuation makes it a very risky proposition to be long unless one resorts to short-term intraday trading, where more flexibility is allowed to manage one’s views depending on the Brexit newsflows. Otherwise, these continue to be rather attractive sell-side prices if you believe the whole Brexit conundrum will get worse before it gets better, which is backed up by the overextended nature of the market. Sooner or later, a reversal back to the mean or baseline (13d ema in my case) must occur. I personally wouldn’t touch the GBP to play in either direction unless applying intraday strategies.
The USD index rebounded quite vigorously from a projected area of demand as highlighted in the chart ever since the FOMC-induced breakout of the baseline. Those looking to gain long-side exposure in the USD were without a doubt given clarity about the best location to engage in the ongoing bullish trend at the intersection of the baseline, with the extra technical addon of being confluent with the horizontal line of support, making the buy-side area ever more compelling. The outlook for the index looks bright after the bullish close on Friday near the daily high.
The CAD index broke above its baseline (13d ema) last Friday but the tapering of aggregate tick volume in the daily chart is of concern even if the rest of indicators (fisher transform and CCI) point to bullish tendencies still present in this market. If bulls re-group to keep pushing into higher levels, there is room for an extra 0.4-0.5% of appreciation in the index before a re-assessment is needed at the recent trend highs. The bullish inertia in Oil prices at the open in Asia should be a positive contributor to the outlook for CAD throughout the day.
The NZD index trades in a clear bearish trend with 0 technical evidence to be supportive of long positions at this stage for a barrage of reasons. The market structure of lower lows and lower highs can’t be disputed, while the current leg lower still has room to fall before the 100% proj target is met. That said, this is an awful level to be short NZD as one’s initial position unless the main purpose is to jump on the bandwagon of short speculators with an intraday momentum strategy, which obviously makes trade management tighter and more manageable.
The AUD index, unlike the NZD, has definitely found an area where I’d expect buy-side activity to pick up considerably. The current level tested is a major macro support as it aligns with a sequence of highs printed through Aug, now retested in the opposite direction, which more often than not, does act as a springboard for a reversal in price behavior. The daily also shows the level of sell-side participating is petering out as the tick volume taper suggests.
The JPY index has broken above the baseline in a move that in my view does not qualify as the onset of further follow-up buying interest to ensue. Not only the breakout occurred in a rather thin volume candle (as per the aggregation of tick volume vs G8 FX), but the index is trading straight into an area of resistance in the chart as per the double rejection in Aug 13, Sept 15. Should the risk appetite trend resume, the JPY is a candidate to continue underperforming.
The CHF index is in a similar position to the JPY when it comes to the lack of buy-side commitment to expect much higher levels from here, however, the advantage it has is the void area available until the next resistance level is met (about 0.2%). Also, in favor of the CHF is the printing of a confirmed double bottom with a break of structure, which in its own right does suggests that the CHF might be setting up for a more meaningful bullish outlook. Any retest of the support level right underneath (-0.15% approx) should attract decent bids.
Important Footnotes
- Risk model: The fact that financial markets have become so intertwined and dynamic makes it essential to stay constantly in tune with market conditions and adapt to new environments. This prop model will assist you to gauge the context that you are trading so that you can significantly reduce the downside risks.
- Cycles: Markets evolve in cycles followed by a period of distribution and/or accumulation.
- POC: It refers to the point of control. It represents the areas of most interest by trading volume and should act as walls of bids/offers that may result in price reversals. The volume profile analysis tracks trading activity over a specified time period at specified price levels. The study reveals the constant evolution of the market auction process.
- Tick Volume: Price updates activity provides great insights into the actual buy or sell-side commitment to be engaged into a specific directional movement. Studies validate that price updates (tick volume) are highly correlated to actual traded volume, with the correlation being very high, when looking at hourly data.
- Horizontal Support/Resistance: Unlike levels of dynamic support or resistance or more subjective measurements such as fibonacci retracements, pivot points, trendlines, or other forms of reactive areas, the horizontal lines of support and resistance are universal concepts used by the majority of market participants.
- Trendlines: Besides the horizontal lines, trendlines are helpful as a visual representation of the trend. The trendlines are drawn respecting a series of rules that determine the validation of a new cycle being created. Therefore, these trendline drawn in the chart hinge to a certain interpretation of market structures.
- Correlations: Each forex pair has a series of highly correlated assets to assess valuations. This type of study is called inter-market analysis and it involves scoping out anomalies in the ever-evolving global interconnectivity between equities, bonds, currencies, and commodities.
- Fundamentals: It’s important to highlight that the daily market outlook provided in this report is subject to the impact of the fundamental news. Any unexpected news may cause the price to behave erratically in the short term.
- Projection Targets: The usefulness of the 100% projection resides in the symmetry and harmonic relationships of market cycles. By drawing a 100% projection, you can anticipate the area in the chart where some type of pause and potential reversals in price is likely to occur, due to 1. The side in control of the cycle takes profits 2. Counter-trend positions are added by contrarian players 3. These are price points where limit orders are set by market-makers. Y