Who is Kevin Hassett? Wolfe looks at the Trump ally tipped to become Fed Chair.
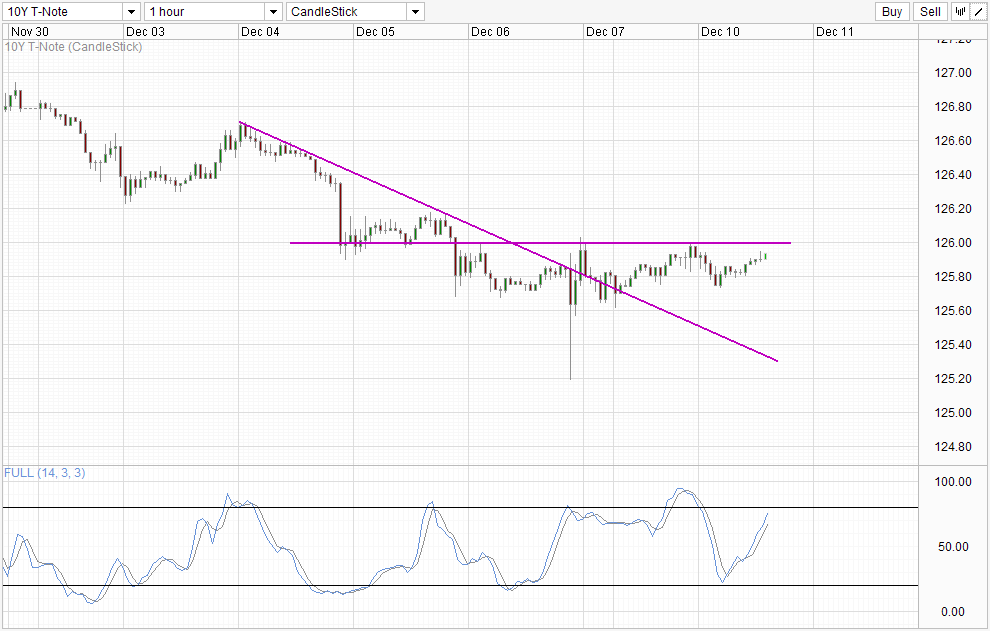
Hourly Chart
Nothing much has changed since the strong slide and subsequent recovery post Non Farm Payroll Friday. The price of the 10Y has been mostly between 125.7 - 126.0, seemingly unaffected by the climb in S&P 500 and Gold. Prices are currently heading towards the 126.0 resistance but based on the meekness of prices in the past 24 hours, it is unlikely that 126.0 will be broken given that there isn't any strong economic news release/announcement that could rock the boat. Furthermore, the Stochastic curve is close to the Overbought region and will definitely be within the Overbought region when 126.0 is tagged, favoring a rebound scenario.
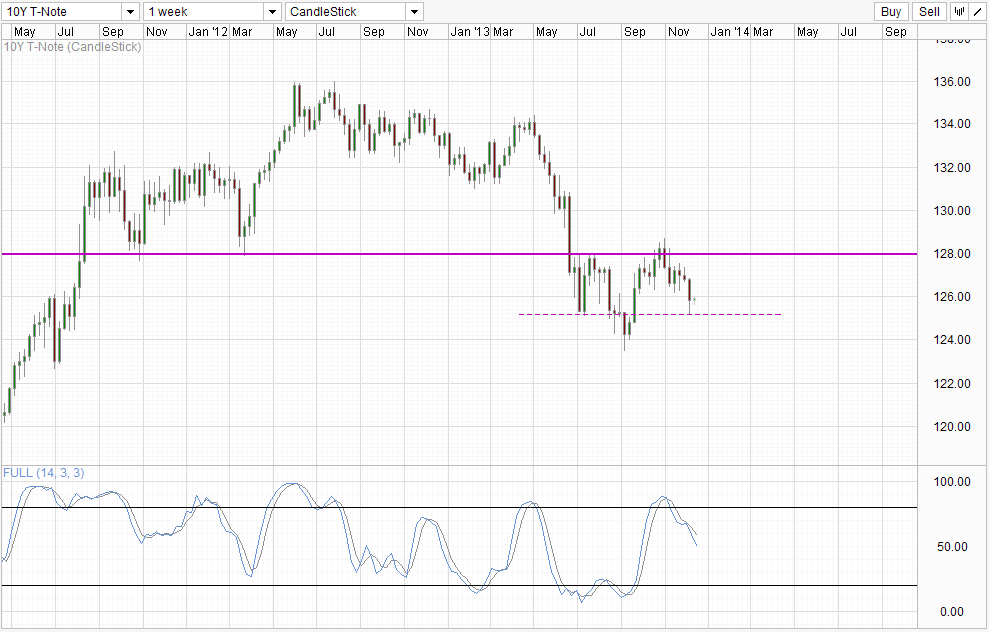
Weekly Chart
The Weekly Chart remains bearish even though prices bounced off the 125.0 support. The Stochastic curve shows us that current bearish cycle remains in play, and we could see further bearish acceleration should Stoch curve breaks the 50.0 "support" level. Looking at the pace of decline, 124.0 may be possible without any interim pullbacks, but a move beyond 124.0 (and above 3.0% in implied yield) may be harder as Stochastic will most likely be within or very close to Oversold region when that happens.
Fundamentally, with Stocks and Gold growing immune to QE Tapering fears, there is a chance that US10Y bearish reaction will be muted moving forward even in the event of an actual taper. Last week's net bullish reaction to a stronger than expected NFP hints at such possibility, and traders may be overly optimistic if they believe that price will simply drop like a rock if a December taper does happen. Nonetheless, long-term direction for the 10Y is still down with or without taper, due to improving US economic health. As Stocks continue to rise, we will be seeing more and more confidence and interest in riskier assets which will naturally drive yields higher (and bond price lower). Therefore, bulls should not feel secure just yet knowing that yields are below historical average and have much higher room for growth.
Original post