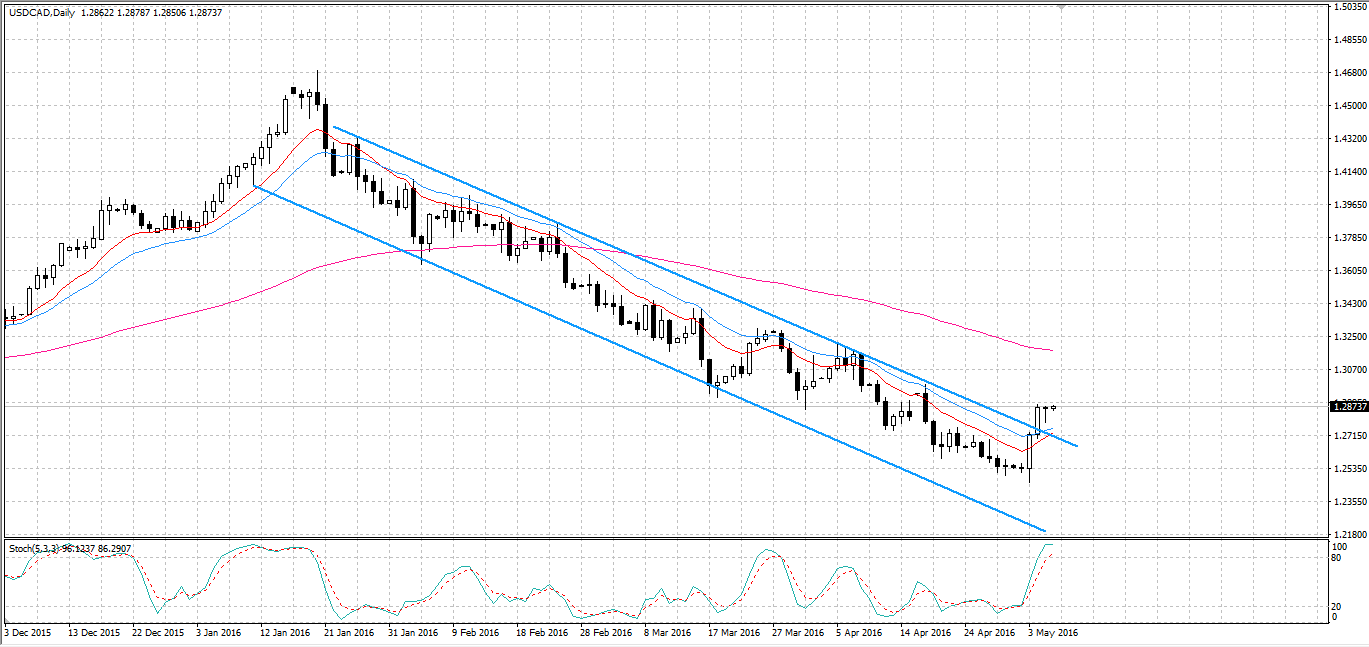
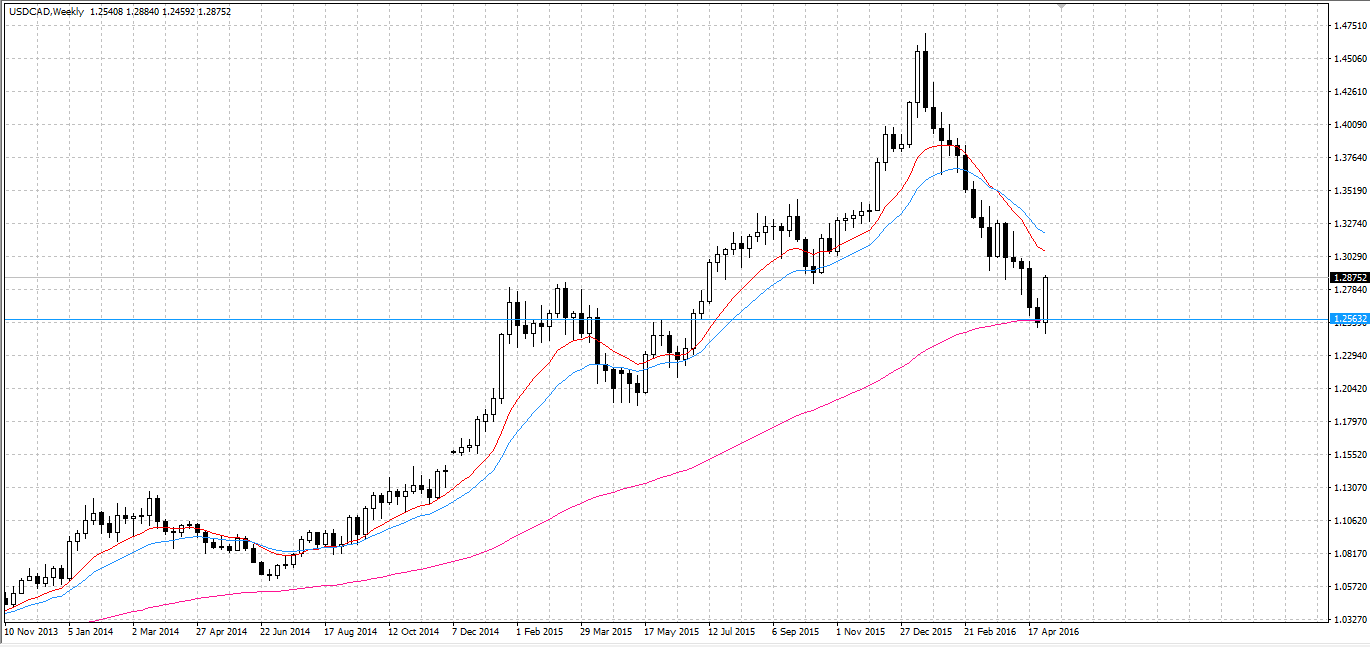
The loonie has been making a prodigious descent this year but a recent rally now has some USD bulls hopeful that the pair has found a bottom. Whilst the 1.2563 support level might very well represent a bottom, there are still a lot of pips between this level and the current price. As a result, the bears might not be quite ready to turn away from the USD/CAD just yet.
On the daily chart, the loonie’s journey to the 1.2563 mark is remarkably consistent and the recent rally is notably one of the largest departures from the prevailing trend. Specifically, the pair has now broken free of the upside constraint of the bearish channel. Arguably, the loonie is now signalling that it is poised to make a recovery. However, it is more likely that the pair enters a ranging phase or even takes another plunge in the coming weeks.

Still looking at the daily chart, the stochastic oscillator provides the first piece of evidence that the loonie might not be ready to extend its recent gains just yet. Presently, stochastics are signalling that the pair is highly overbought which will be causing selling pressure to mount. Additionally, the presence of a Hanging Man candle could be hinting that a reversal is close at hand.

Taking a peek at the weekly chart, it’s shown that the recent rally may have resulted from the 100 Week EMA acting as a strong dynamic support. When the loonie hit the EMA, the market reacted strongly and bid the pair higher. The resulting buying frenzy was an overreaction to a technical indicator and not a sign of an improvement in the US economy relative to its North American neighbour.
Consequently, the pair should be correcting to the downside relatively soon, especially if poor US employment data causes the USD to weaken again. What’s more, we have some clues that the impending US Non-Farm Employment Change Result could be set to post a poor figure. Specifically, the ADP Non-Farm Employment Change result recently came in significantly below expectations at 156K. Likewise, there was a build in US Unemployment Claims up to 274K which was much higher than the predicted 260K. Consequently, the impending Non-Farm Employment figures could disappoint just as badly.
In the event the US results disappoint over the weekend, come Monday, the loonie could correct itself to the downside. The most probable outcome will see the pair retrace to the support which many believe to be a bottom. However, an increasingly sickly US economy might cause the loonie to collapse once again and look for a new low. Ultimately, we shall have to wait and see if the US Non-Farm Employment Change can defy the poor examples being set by the last two pieces of US employment data.
