Like a tightly-coiled spring, major US indices and sectors remain trapped in tight consolidation zones, so far this year, as shown on the following daily charts.
What's remarkable is that the swings on their rate-of-change (ROC) indicators (with an input value of 1 day) have been getting smaller and smaller...hinting that markets may explode in one direction or the other at some point.
As yet, the catalyst to drive such a move remains a mystery. Perhaps more will be revealed next Wednesday (May 2) when the Fed's interest-rate decision is announced, along with any new forward-guidance revelations.


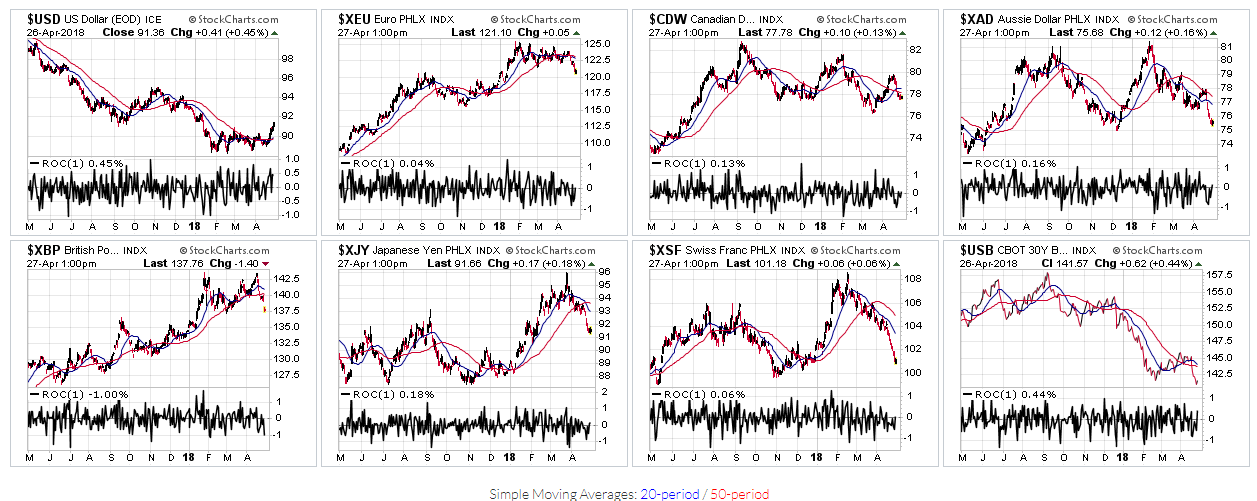
In this regard, keep an eye on the major currencies' ROC for clues, as well as US Bonds. While the ROC is expanding (to the downside) on the XBP, it is expanding (to the upside) on the USD and the others remain trapped, as shown on the daily charts below.
A major shift into USD and USB buying may signal a weakening of equities.

