🐂 Not all bull runs are created equal. November’s AI picks include 5 stocks up +20% eachUnlock Stocks

U.S. Stocks Ready To Move

Published 09/08/2015, 01:59 AM
Updated 05/14/2017, 06:45 AM
ESZ24
-

Now that the dust has settled in the US markets, and with a public holiday to boot, US stocks have consolidated into a nice pennant shape. Does this mean they are gearing up for a breakout?

The wild swings in the US stock markets, and indeed global stock markets, have largely cooled off. The move saw the S&P 500 September futures go from 2103.00 to a low of 1830.25. The move wiped out almost a year’s worth of gains and touched a level not seen since October 2014. China was largely to blame for the market turmoil, as its years of boom look to be grinding to a halt.

The slowdown in China has made the markets very nervous that it will spread worldwide and cause a global recession, and the stock markets are the best barometer for the global economy. That fear has given way to relief which has seen stocks consolidate around the current level at 1935.00.

Next week will be a big one for the markets with the US FOMC meeting to set interest rates. They are largely expected to hold rates steady, and if they do, what they say could have a big impact. If they are pessimistic about the near future, we could see a sharp retracement in stocks. If they raise rates, that will also be bearish for stocks, as fixed interest assets will now yield relatively more. Then there is October,the month that so often spooks markets into selling.So there are some reasons to be cautious going forward.
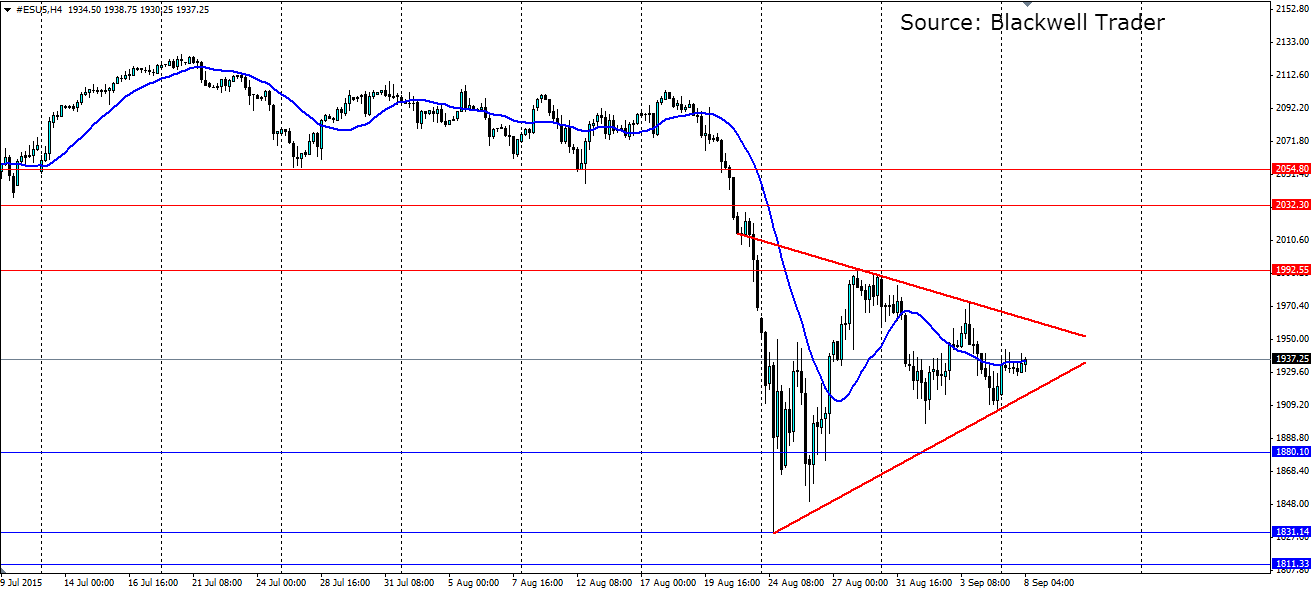
ES US, H4 Chart

Technicals also suggest a cautious approach is appropriate. In fact they suggest a sharp downside breakout is possible. The consolidation of the S&P500 September futures is a classic pennant shape that, when it fails, will likely see a continuation of the trend, and in this case that is bearish.

Either way a cautious approach is the best option in these nervous times. If we see a breakout lower, look for support at 1880.10, 1831.14 and 1811.33. If we see an upside push, look for resistance at 1992.55, 2032.30 and 2054.80.

Latest comments

Loading next article…
Risk Disclosure: Trading in financial instruments and/or cryptocurrencies involves high risks including the risk of losing some, or all, of your investment amount, and may not be suitable for all investors. Prices of cryptocurrencies are extremely volatile and may be affected by external factors such as financial, regulatory or political events. Trading on margin increases the financial risks.
Before deciding to trade in financial instrument or cryptocurrencies you should be fully informed of the risks and costs associated with trading the financial markets, carefully consider your investment objectives, level of experience, and risk appetite, and seek professional advice where needed.
Fusion Media would like to remind you that the data contained in this website is not necessarily real-time nor accurate. The data and prices on the website are not necessarily provided by any market or exchange, but may be provided by market makers, and so prices may not be accurate and may differ from the actual price at any given market, meaning prices are indicative and not appropriate for trading purposes. Fusion Media and any provider of the data contained in this website will not accept liability for any loss or damage as a result of your trading, or your reliance on the information contained within this website.
It is prohibited to use, store, reproduce, display, modify, transmit or distribute the data contained in this website without the explicit prior written permission of Fusion Media and/or the data provider. All intellectual property rights are reserved by the providers and/or the exchange providing the data contained in this website.
Fusion Media may be compensated by the advertisers that appear on the website, based on your interaction with the advertisements or advertisers.
© 2007-2024 - Fusion Media Limited. All Rights Reserved.