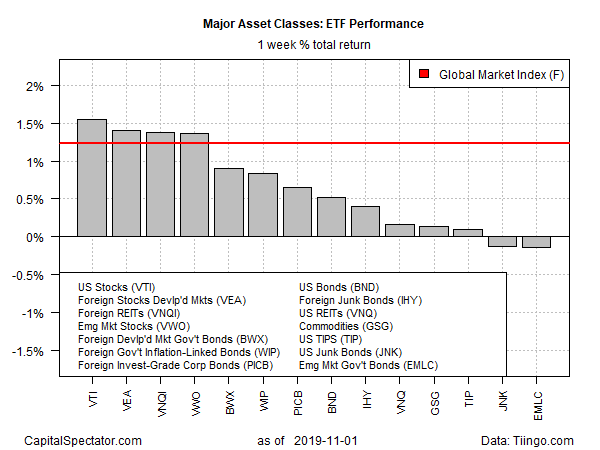
Equities in the United States edged out the rest of the world for the trading week’s performances ended Friday, Nov. 1, based on a set of exchange-traded funds that represent the major asset classes.
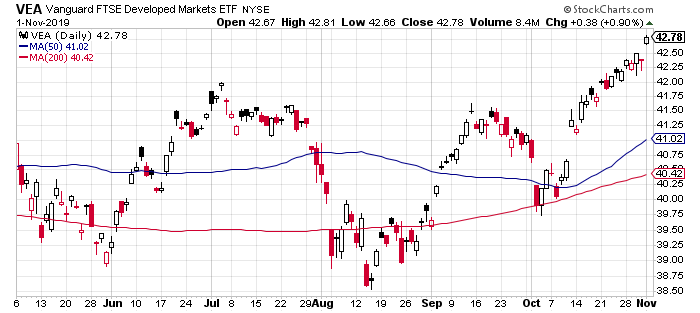
In a week that witnessed rallies in most of the global markets, Vanguard Total Stock Market (NYSE:VTI) took the lead over the rest of the field. VTI rose 1.6%, or slightly ahead of last week’s second-best performer: foreign stocks in developed markets via Vanguard FTSE Developed Markets (NYSE:VEA), which climbed 1.4%.
The top-performing bullish momentum in the U.S. is also conspicuous on a longer-term basis relative to the rest of the world, The Wall Street Journal reports.today:
“Global stocks are lagging behind U.S. shares, illustrating how investors’ faith in the domestic economy continues to drive a growing divergence in financial markets,”
Foreign equities, however, are playing catch-up lately. Although VEA lags VTI this year, over the last month foreign stocks in developed markets have outpaced U.S. shares by a small margin. A strong rally in VEA on Friday lifted the fund to its highest close in well over a year.

Among the handful of asset class losers last week, government debt in emerging markets posted the deepest loss. VanEck Vectors JP Morgan EM Local Currency Bd (NYSE:EMLC) slipped fractionally, dipping 0.1%.

The broad-based rally continued to lift an ETF-based version of the Global Market Index (GMI.F). This unmanaged benchmark, which holds all the major asset classes (except cash) in market-value weights, rose 1.2% last week – a strong gain that marks the index’s fourth straight weekly advance.
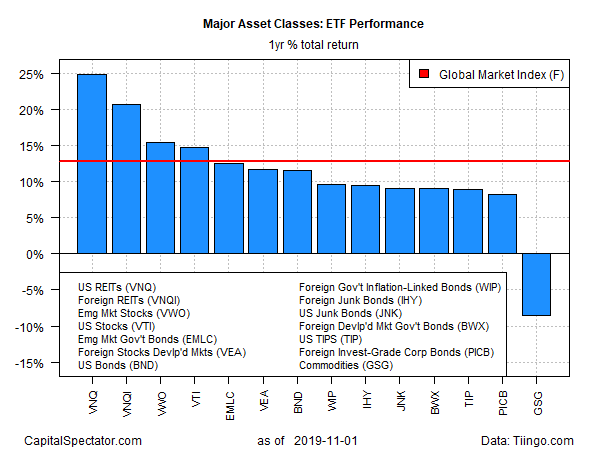
For the one-year profile, U.S. real estate investment trusts continued to lead the major asset classes by a comfortable margin. Vanguard Real Estate (VNQ) was up 24.8% on a total return basis for the trailing one-year window at Friday’s close (based on trailing 252 trading days).
Broadly defined commodities remain in last place for the one-year change. The iShares S&P GSCI Commodity-Indexed Trust (GSG) has lost 8.5% over the past year.
Meanwhile, GMI.F’s trailing one-year period has accelerated recently and the benchmark is now up a sizzling 12.9% vs. the year-ago level after factoring in distributions.

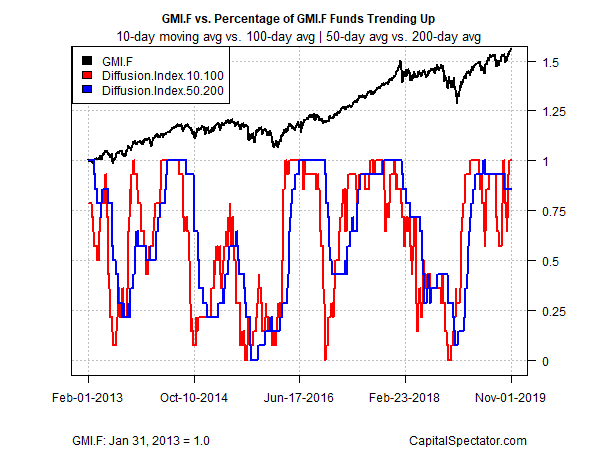
Reviewing all the ETFs listed above through a momentum lens continues to reflect a strong upside bias in most markets. The analysis is based on two sets of moving averages. The first compares the 10-day moving average with its 100-day counterpart — a proxy for short-term trending behavior (red line in chart below). A second set of moving averages (50 and 200 days) represent the intermediate measure of the trend (blue line). At Friday’s close, a bullish tailwind was priced into nearly every component of the major asset classes.

