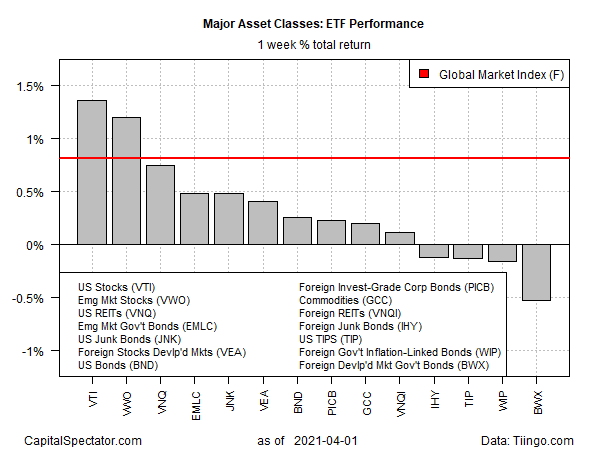
Shares in US companies topped returns for the major asset classes last week, based on a set of exchange traded funds through Apr. 1. The rally in American stocks unfolded in a week when global equities overall posted solid gains.
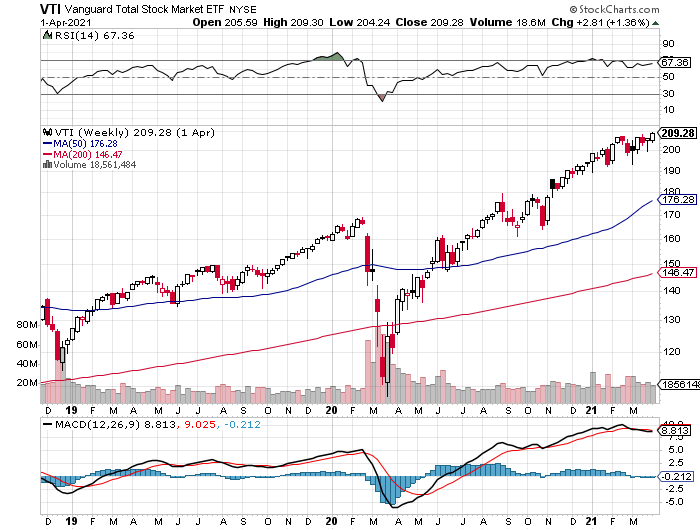
Vanguard Total Stock Market Index Fund ETF Shares (NYSE:VTI) rose 1.4%, lifting the ETF to a record high at the close of a shortened trading week.

Foreign stocks in developed and emerging markets also rallied. Vanguard FTSE Developed Markets Index Fund ETF Shares (NYSE:VEA) rose for a fifth straight week, gaining 0.4%. Meanwhile, Vanguard FTSE Emerging Markets Index Fund ETF Shares (NYSE:VWO) jumped 1.2%, posting its first weekly advance after two straight weeks of losses.
Despite the bullish momentum in stocks recently, Johanna Chua, Asia Pacific chief economist for Citigroup Global Markets, reminds that there are risks to consider in the second quarter. Stated Chua:
“The repricing of inflation risk and US rates, which will impact discount rates of future earnings and the way stocks are being valued, is a source of uncertainty. The other uncertainty is the pace of the vaccinations and the virus.”
Downside risk for pricing assets last week was mainly concentrated in foreign bonds. The biggest loss for the major asset classes: fixed income in foreign developed markets.
Broadly speaking, however, it was a solid week for risk assets as last weeks’ risk-on rally lifted the Global Markets Index (GMI.F). This unmanaged benchmark, which holds all the major asset classes (except cash) in market-value weights via ETF proxies, rose 0.8%, building on the previous week’s gain.

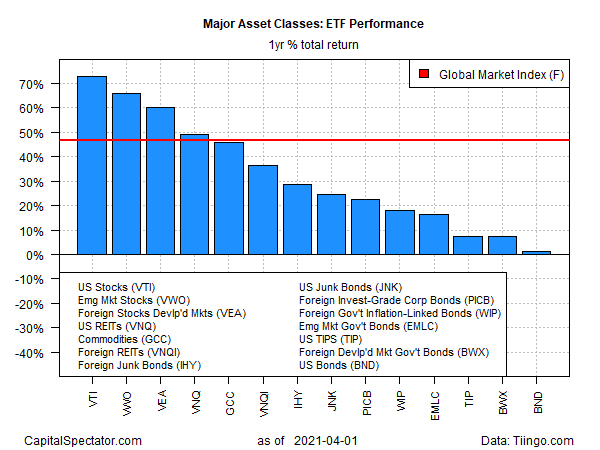
As mentioned above, reviewing the one-year trend for assets, US stocks are the top performer for the major asset classes through last week’s close. Vanguard Total US Stock Market (VTI) is up 69.4% on a total return basis over the past 12 months.
Note that one-year returns for global markets generally are unusually high at the moment because year-ago prices were dramatically depressed due to the coronavirus crash. Accordingly, trailing one-year results will remain temporarily elevated due to extreme year-over-year comparisons until last year’s markets collapse washes out of the annual comparisons.
Note, too, that all the major asset classes are posting one-year gains through last week’s close. The softest increase: investment-grade bonds in the US via Vanguard Total Bond Market Index Fund ETF Shares (NASDAQ:BND), which closed with a slim 0.9% total return vs. the year-ago price.
GMI.F is up 46.4% for the past year.

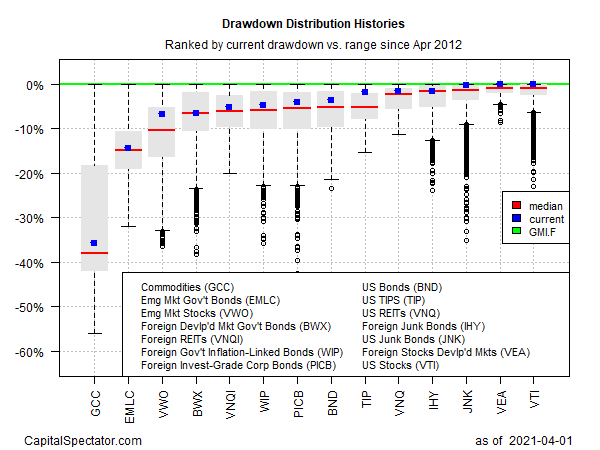
Monitoring funds through a drawdown lens shows that US stocks are posting the smallest drawdown for the major asset classes. Thanks to VTI’s rally to a record close last week, US equities are currently enjoying a zero peak-to-trough decline.
The deepest drawdown is still found in broadly defined commodities via WisdomTree Continuous Commodity Index Fund (NYSE:GCC): the ETF, which equally weights a broad basket of commodities, is down 35.7% from its previous high.
GMI.F’s current drawdown is a fractional 0.1% slide from its previous peak.

