The US equity market has had a volatile year, but the higher risk has paid off… big time. In absolute and relative terms the numbers speak volumes. And the outperformance isn’t limited to recent history. Over a five-year trailing period, for example, the stock market in the US has left the rest of major asset classes in the dust.
Should investors be worried? Wrong question. A better way to frame current conditions: Anyone sitting on sizable gains driven by US equities, or overseeing a portfolio that’s heavily weighted in US stocks, should consider rebalancing. That’s not a forecast that stocks are about to crumble. For all I know they’ll run higher for longer than anyone expects. But for mere mortals focused on risk management vs. maximizing performance there’s a good case for thinking that a round of nipping and tucking on the asset allocation front is timely.
One input for that decision is the stellar performance in stocks vs. the rest of the field. Although a prudent rebalancing strategy shouldn’t rely on return alone, it’s hard to overlook the fact US equities have generated a stunning premium over the other major asset classes.
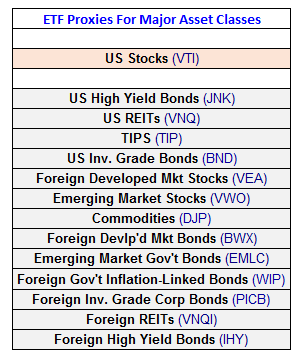
For some perspective, let’s stack up results for a set of exchange-traded products that represent the major asset classes:
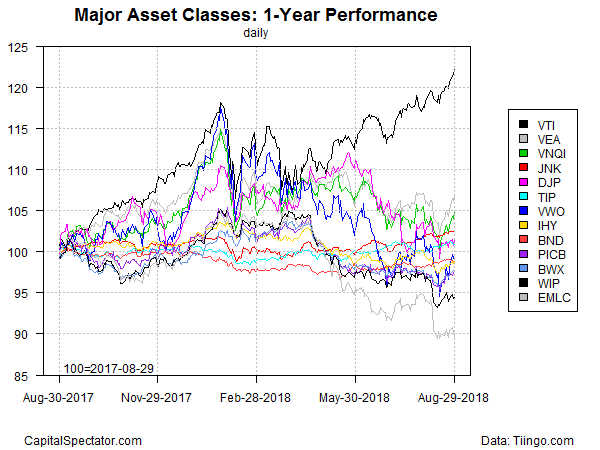
Consider how Vanguard Total Stock Market (NYSE:VTI), a broad-minded US equity fund, has performed over the last year vs. the rest of the field for the trailing one-year window. As the chart below reminds, US equities have been on a tear in recent months. A $100 investment a year ago in VTI is worth more than $122 as of yesterday’s close (August 29). The next best performer — Vanguard FTSE Developed Markets (NYSE:VEA) – is currently worth a distant $106.
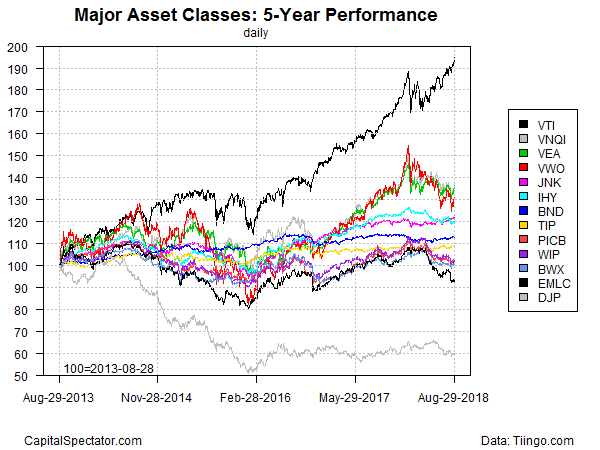
The runaway performance for US stocks is hardly a recent phenomenon. Over the past five years the return gap is even wider, as the next chart shows. A $100 investment in VTI five years ago surged to nearly $200 by yesterday’s close. By comparison, the same investment in the other major asset classes has delivered gains of less than $140 over that span, and in several cases a lot less.
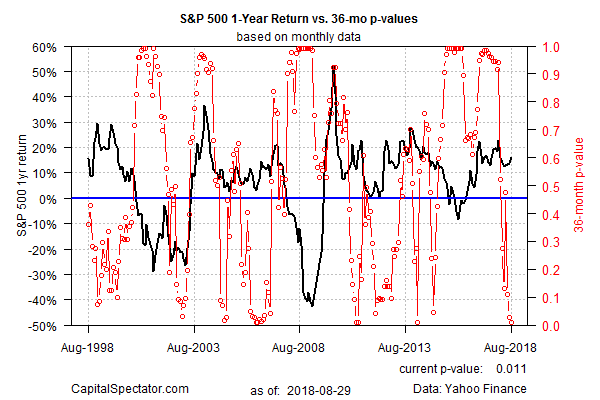
Curiously, the US stock market doesn’t appear to be in a bubble at the moment, based on an econometric technique outlined here. That’s no guarantee that equities can’t suffer a sharp correction, but it’s a clue for thinking that the evidence is weak at the moment for arguing that irrational exuberance has run amuck. Then again, the bubble test presented below could be misleading, although the technique has provided a relatively useful gauge in the past (for some perspective, see this analysis).
Stocks can slide for many reasons, of course, even when valuation is reasonable and/or bubble risk is low. That said, the cyclically adjusted price-to-earnings ratio (CAPE) — compiled by Professor Robert Shiller and updated via multpl.com — looks elevated, although a number of analysts advise against using this metric as a short-term timing tool.
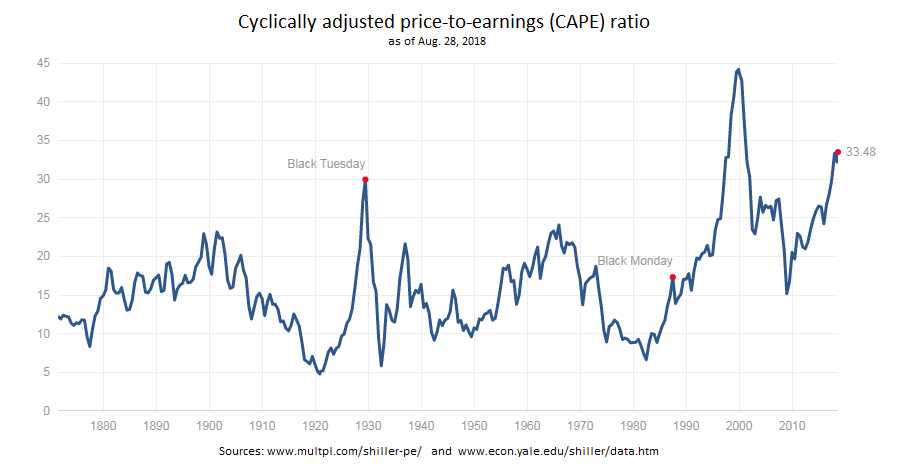
Keep in mind that there’s a case for thinking that the strong run in US equities is linked with the upbeat trend in economic conditions. Indeed, recession risk for the US at the moment is virtually nil because growth is strong. Output was revised up yesterday to 4.2% in the update on GDP, the Bureau of Economic Analysis reported – the strongest gain in four years.
Meanwhile, some GDP nowcasts are looking for even stronger growth in Q3. The latest GDPNow estimate (August 24) from the Atlanta Fed is projecting that this quarter will witness a sizzling 4.6% increase in output.
In short, there’s economic support for arguing that the rally in US stocks is warranted. True, but that doesn’t mean that the equity run isn’t raising warning flags.
In the end, a rebalancing strategy should be based on current conditions in a portfolio. If the current weight for an asset class is well above the target weight, it’s probably time to rebalance – regardless of external market or economic conditions. By that standard, the recent surge in US stocks suggests that there are more than a few portfolios in need of tweaking on the asset allocation front.
