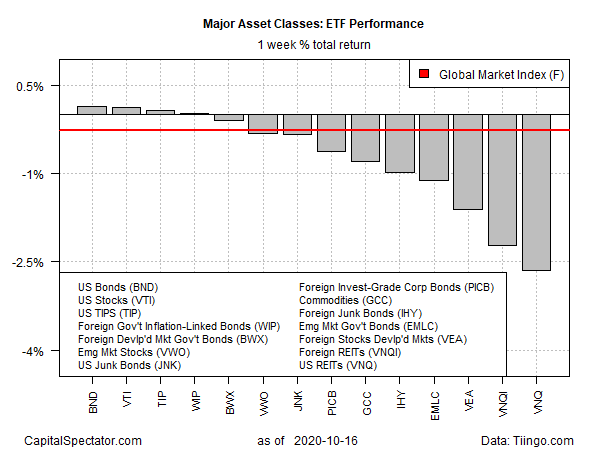
Most slices of the major asset classes declined last week but US stocks and bonds managed to post small gains for the trading week through Friday, Oct. 16, based on a set of exchange-traded funds.
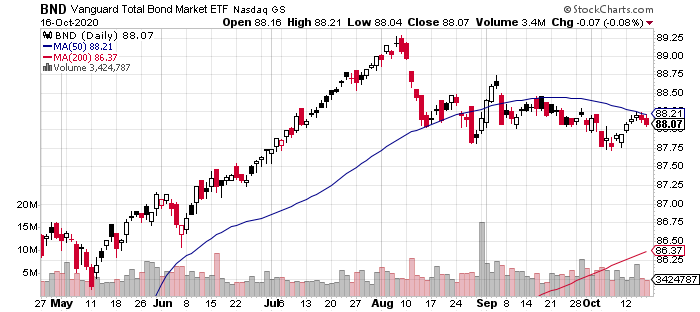
Vanguard Total Bond Market Index Fund (NASDAQ:BND) eked out the winning performance last week with a 0.2% gain. The fund has been in a relatively tight trading range since late-August and last week’s performance didn’t deliver a breakout. Despite the latest weekly advance, BND’s recent daily prices suggest the ETF’s trend is rolling over.

US equities were a close second-place gainer last week. Vanguard Total Stock Market Index Fund (NYSE:VTI) ticked up 0.1%. Based on weekly close prices, VTI ended at a record high on Friday, although on a daily basis the ETF is still slightly below its Sept. 2 peak.
Equity investors are processing several risk factors that could potentially be major catalysts for price changes in the weeks ahead, notes an analyst. “The many cross-currents we have been fretting over in recent weeks remain omnipresent.”
Sherif Hamid, a strategist at Jefferies, advises in a note to clients,
“The US elections are close at hand, fiscal stimulus remains a key near-term potential catalyst, and developments on the virus front remain critical to the longer-term outlook.... a lot is very likely to happen over the next several weeks, and the broader macro picture could thus change pretty massively depending on developments along all of those fronts.”
Most of the major asset classes fell last week, with US real estate investment trusts (REITs) suffering the biggest setback. Vanguard Real Estate Index Fund (NYSE:VNQ) dropped 2.7%, the first weekly loss in the past three. Despite the latest round of red ink, VNQ continues to show signs of a modest upside trend in recent history.
The Global Markets Index (GMI.F) fell 0.3% last week. This unmanaged benchmark, which holds all the major asset classes (except cash) in market-value weights via ETFs, rose 2.7%—its first calendar-week dip so far in October.

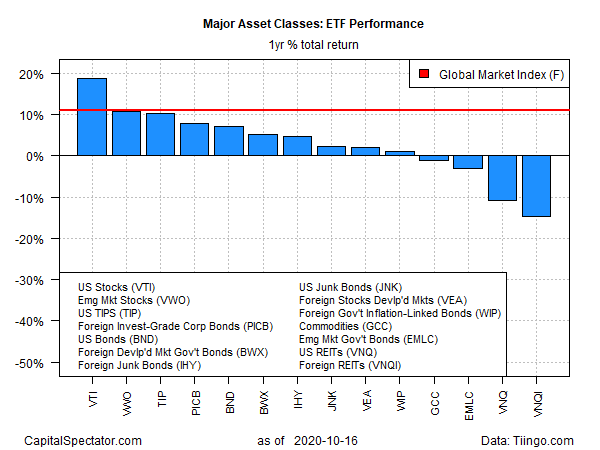
For the one-year window, US stocks continue to lead the major asset classes by a healthy margin. VTI is up 19.2% on a total return basis for the trailing 12-month period.
Foreign property is the weakest performer over the past year for the major asset classes. Vanguard Global ex-U.S. Real Estate Index Fund (NASDAQ:VNQI) is in the red by 14.5% as of Friday’s close vs. the year-ago price (including distributions).
GMI.F’s one-year performance is currently a solid 11.1%.

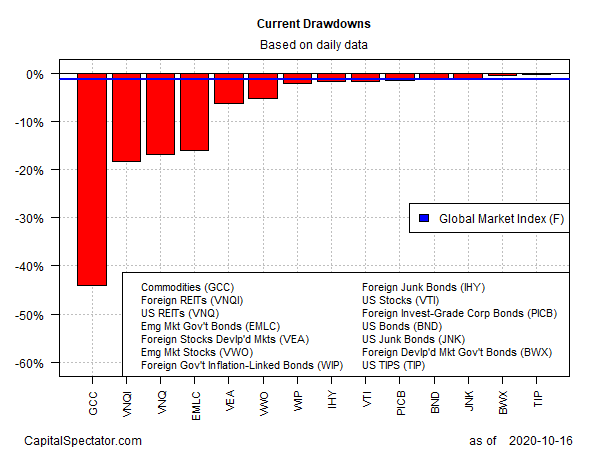
Profiling the major asset classes based on current drawdown shows that about half are posting slight peak-to-trough declines. The smallest drawdown at the moment: iShares TIPS Bond (NYSE:TIP), which ended the week just fractionally below its previous peak.
The deepest drawdown: broadly defined commodities via WisdomTree Continuous Commodity Index (NYSE:GCC), which is more than 40% below its previous high.
GMI.F’s current drawdown is a modest -1.2%.

