
Nasdaq 100:
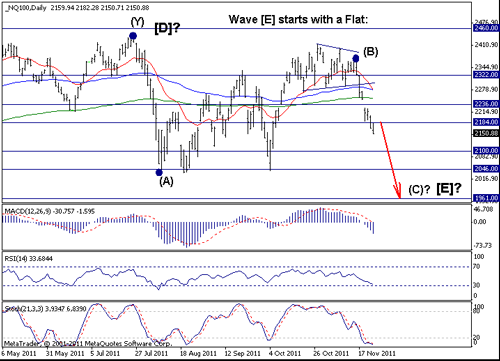
Nasdaq 100:2150.88
Short-Term Trend: sideways
Outlook:
After the breakdown that we saw a week ago, Nasdaq 100 was under huge downside pressure every day last week (except for Thursday when the market was closed). The technical evidence suggests further weakness is likely to be seen this week twd 2100 and 2046, but right now it is difficult to find a low-risk entry on the short side (so, if you are already short, congratulations!). I think that if a rally twd 2236 develops somehow, then this rally should be used as a selling opportunity. But I don't know if such a rally will develop this week. On the upside, only if the prices move abv 2280/90 (prev. support), the daily chart will turn neutral to positive.
Strategy: Stand aside.
S&P500:
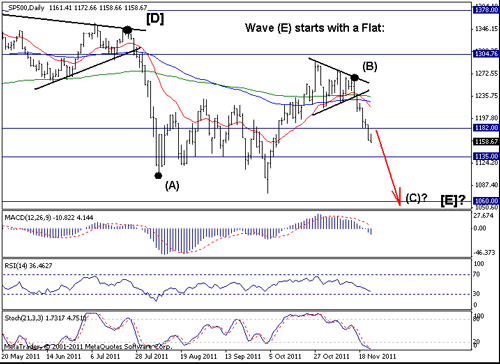
S&P500:1158.67
Short-Term Trend: downtrend
Outlook:
A week ago we disucssed the breakdown below the important 1210 support. Last week the market continued its decline and thus further confirmed our bearish veiw. The confidence is now higher that wave (C) down from the late July top is under way. If correct, the market should continue to trade under pressure and weakness twd 1060 is expected. The daily chart has quickly become oversold, so that may be some kind of a problem for the bears, but usually the oversold conditions do not bring trend reversals, but only sharp counter-trend moves.
Only a move abv 1210/20 will negate the current bearish view.
Strategy: Holding short is favorable against 1230 with a target at 1060.
Nasdaq 100:2150.88
Short-Term Trend: sideways
Outlook:
After the breakdown that we saw a week ago, Nasdaq 100 was under huge downside pressure every day last week (except for Thursday when the market was closed). The technical evidence suggests further weakness is likely to be seen this week twd 2100 and 2046, but right now it is difficult to find a low-risk entry on the short side (so, if you are already short, congratulations!). I think that if a rally twd 2236 develops somehow, then this rally should be used as a selling opportunity. But I don't know if such a rally will develop this week. On the upside, only if the prices move abv 2280/90 (prev. support), the daily chart will turn neutral to positive.
Strategy: Stand aside.
S&P500:1158.67
Short-Term Trend: downtrend
Outlook:
A week ago we disucssed the breakdown below the important 1210 support. Last week the market continued its decline and thus further confirmed our bearish veiw. The confidence is now higher that wave (C) down from the late July top is under way. If correct, the market should continue to trade under pressure and weakness twd 1060 is expected. The daily chart has quickly become oversold, so that may be some kind of a problem for the bears, but usually the oversold conditions do not bring trend reversals, but only sharp counter-trend moves.
Only a move abv 1210/20 will negate the current bearish view.
Strategy: Holding short is favorable against 1230 with a target at 1060.