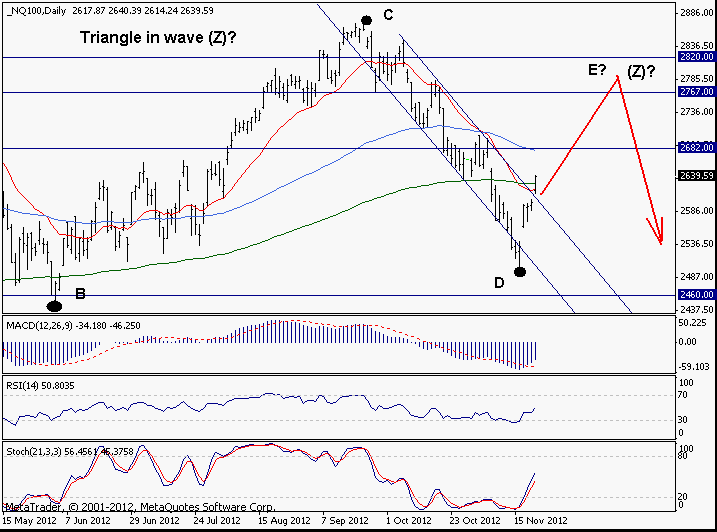
Nasdaq 100:
2639.59
Short-Term Trend: Sideways
Outlook: Well Nasdaq 100 ralied strongly last week and thus justified completely our previous decision to exit the short position from 2797. Now, we have strong reasons to believe that wave D of the suspected Triangle from December 2011 low has ended. If that's the case, a rally toward 2762 level is now under way. As you can see from the chart, the daily oscillators are on strong buy signals, so they support this bullish view.
Only a move back below 2560 will negate the above bullish idea and will risk one more fall twd 2500/2460 area....
Strategy: Longs favored at 2600 against 2555. Target=2760
S&P500
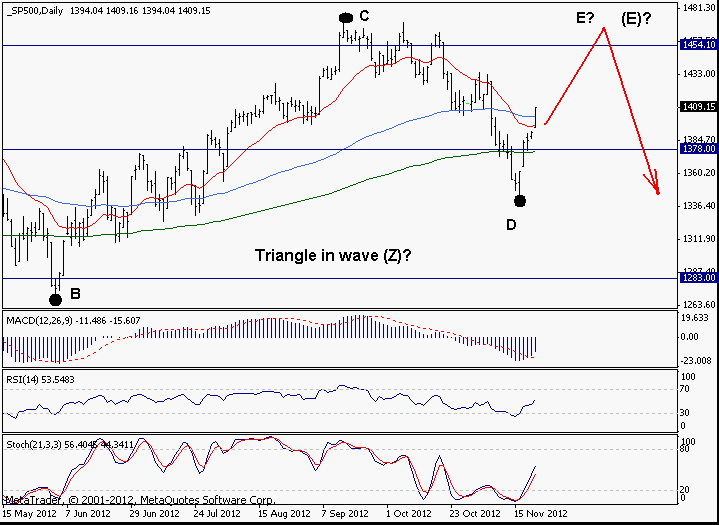
S&P500: 1409.15
Short-Term Trend: Sideways
Outlook: The sharp rally last week has negated the previous downtrend and now the daily chart is in sideways mode. Thus, our wave structure has been further re-inforced and we expect now a rally toward the 1454 Fibonacci level. Then in early 2013 we will look for a major reversal. The daily oscillators are on buy signals and support this bullish short-term view.
On the downside, a move below 1370 negates, risks weakness toward 1330/10 before another rise is seen...
Strategy: Longs favored at 1395. Stop=1365. Target=1455.
