Nasdaq 1003

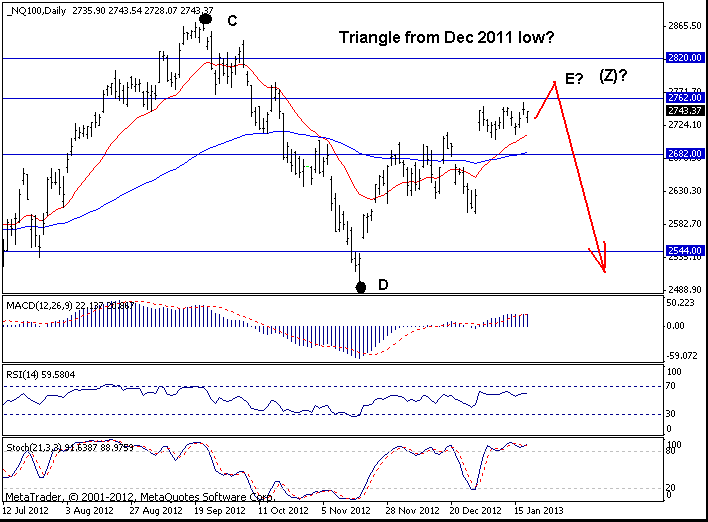
Nasdaq 100:
2743.37
Short-Term Trend: Sideways
Outlook: We had a relatively quiet week in which Nasdaq 100 made a new high at 2765 for the current upmove from the Nov 2012 low. But the 2762 level has not been reached yet. So far there are no signs of a trend reversal which means we may see further rally this week twd 2762 and possibly 2820 before the market trend reverses. Based on my bearish expectations on the weekly chart, one can favor a short position if a move higher develops this week.
On the downside, only a move below 2682 will indicate that a Short-Term top is finally in place...
Strategy: Shorts favored at 2800. Stop=2835.
S&P500
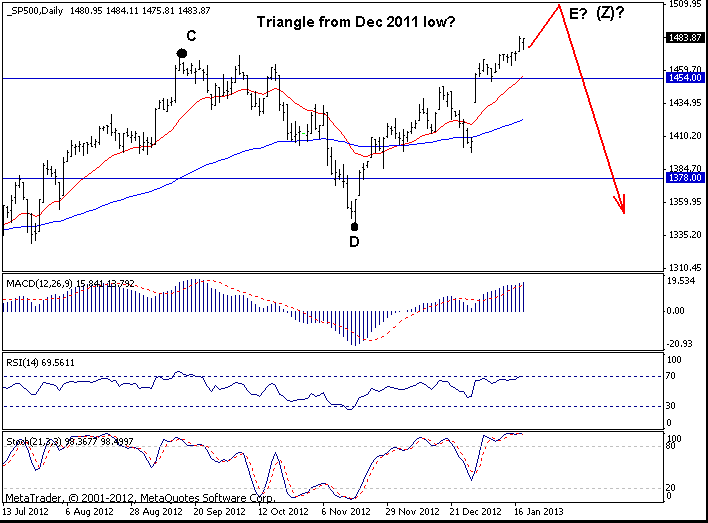
S&P500: 1483.87
Short-Term Trend: uptrend
Outlook: S&P500 continues its upmove from the Nov 2012 low and is now making new post 2008 highs. The upmove on the daily chart is quite strong as the prices are firmly above the rising 21-day moving average. So, higher prices can be expected. But we continue to believe that the upside is limited from here and a move above 1520 is unlikely at this stage.
On the downside, only a decline below 1454 Fibonacci level will signal that the current upmove might have ended and only below 1420 will confirm that.
Strategy: Stand aside.
