Nasdaq 100

Nasdaq 100:
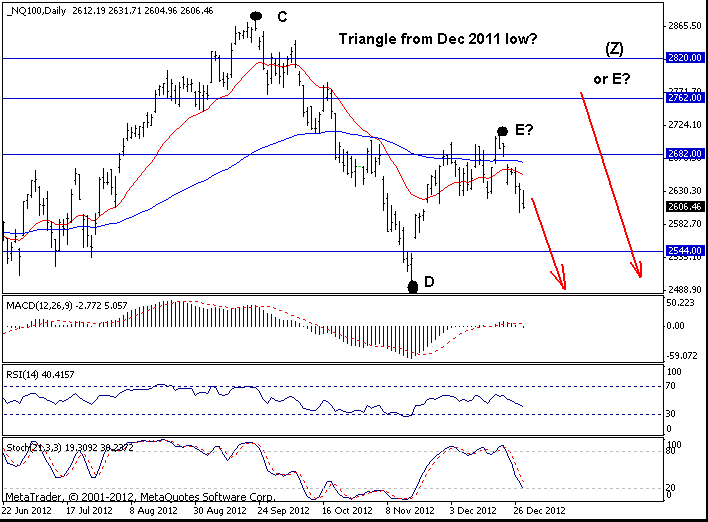
2606.46
Short-Term Trend: Weak downtrend
Outlook: The market surprised us with a big decline last week and brought a signal that wave E might have ended already. The daily chart looks negative now and further weakness toward 2544 level can be expected. A sustained trading below there will virtually confirm the completion of the entire bull market from the Mar 2009 low.
Despite this bearish analysis, I am not ready to turn short yet. Why? - because the market is usually positive in the first few days of January. Based on the current pattern, I suspect that this year the market will fail to rise in the first few days. But I prefer to wait for more signals before turning fully bearish here.
Strategy: Stand aside.
S&P500
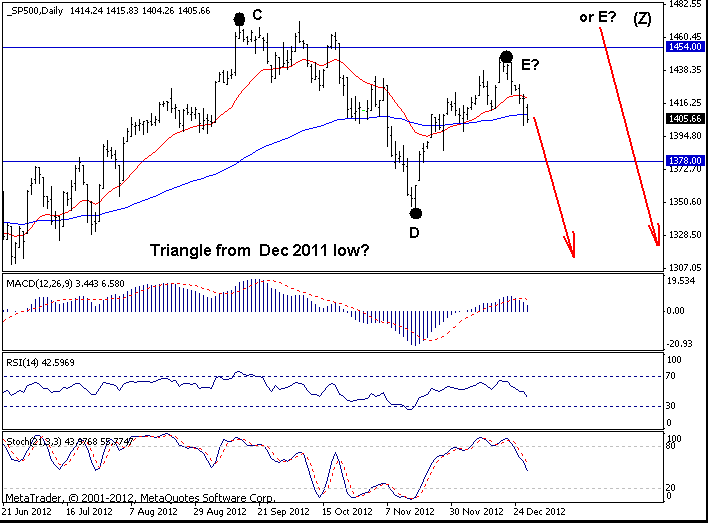
S&P500: 1405.66
Short-Term Trend: Sideways
Outlook: The market moved below 1411 level last week and thus negated the series of higher highs and higher lows from the Nove 2012 low. And by doing that, it has signalled a negative reversal which most likely means wave E is complete. A close below 1400 will further confirm the bearish case here and will likely bring weakness toward 1343 level (November low). On the upside, only a rally back above 1430 will negate and will suggest one more rally toward 1454 and possibly to 1475 level...
Strategy: The hypothetical long from 1395 was stopped out at 1410 with 15 points profit. Stand aside.
