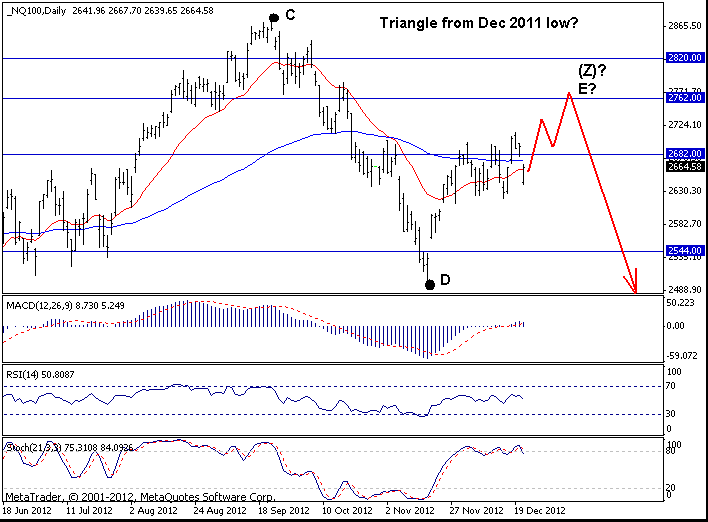
Nasdaq 100

Nasdaq 100:
2664.68
Short-Term Trend: Sideways
Outlook: This market was extremely volatile last week. It first rose sharply from 2620 to 2713 but then retreated sharply on Friday on fiscal cliff news. The price pattern now is unclear but I think this market is still not ready to turn lower. So, ideally the 2620 level will hold as support this week and another rally toward 2713 and then eventually to 2762 level will be seen. On the downside, a move below 2620 will be a negative signal and will suggest weakness toward 2500...
Strategy: Stand aside.
S&P500
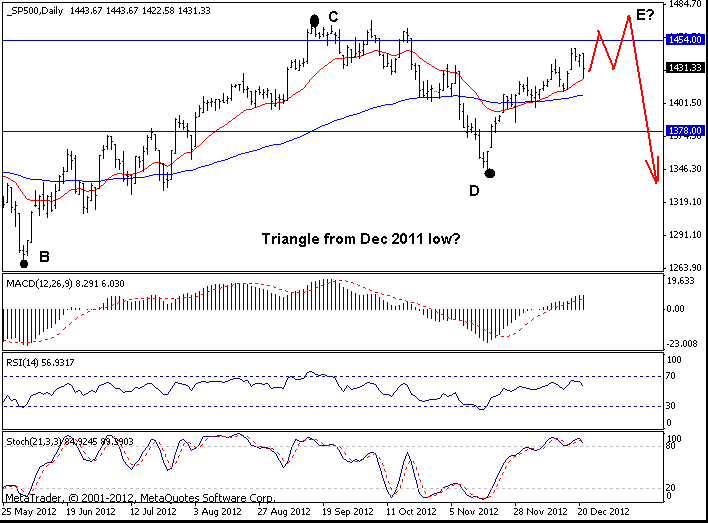
S&P500: 1431.33
Short-Term Trend: Weak uptrend
Outlook: S&P500 rose to 1447 initially but then fell sharply on Friday on the fiscal cliff news to as low as 1422. Still, the price pattern here is much more bullish than the one in Nasdaq 100. Notice that the prices are above the rising 21-day moving average despite the Friday's sell-off. So, the path of least resistance remains higher in my view and I continue to expect the 1454 Fibonacci level. Actually I think this market has potential to even test the 1475 level before a long-term top is made.
On the downside, a move below 1411 will change the immediate pattern of higher highs and higher lows so it makes sense to consider a protective stop just below this level....
Strategy: Holding long from 1395 is favored. Stop=1410. Target=1455.
