:
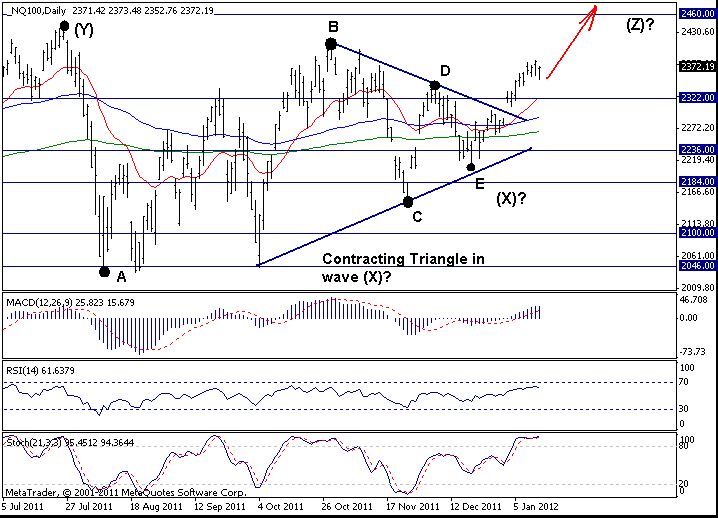
Nasdaq 100: 2372.19
Short-Term Trend: sideways
Outlook:
The reason why the trend on the daily chart is still labelled sideways is because the the prices remain below the key 2400 level. Once this level is taken out, the Short-Term trend will be considered upward. As said before, I feel that this is going to happen and that's why I favored a long position a week ago. But some caution is needed now because we are entering a seasonally negative 2-week period for Nasdaq 100. So, it is important to see how this market will behave this coming week.
On the downside a move below 2300 will be a clear sign that the previous broad trading range is still intact and weakness twd 2200 can be expected....
Strategy: Holding long from 2360 is favored. Stop= below 2300. Target=2460. 
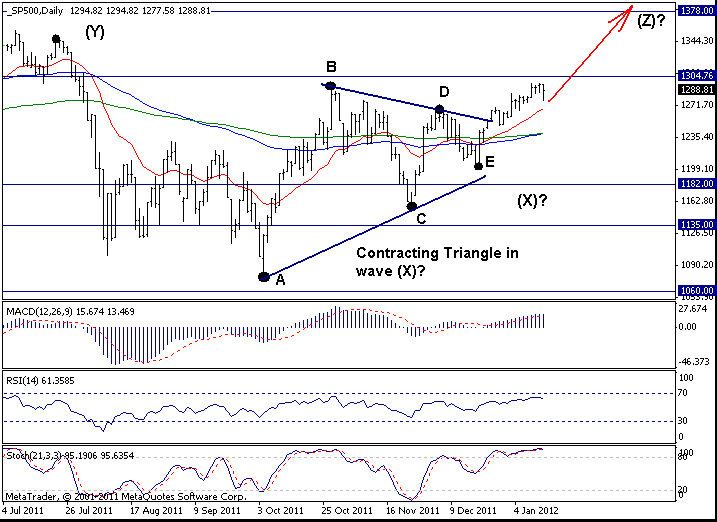
S&P500: 1288.81
Short-Term Trend: uptrend
Outlook:
S&P500 managed to move abv the 1285/90 resistance, but so far remains below 1300 level. Thus, the bulls still need to prove that they have the full control. But I am pretty confident the bulls will succeed this week as the price pattern remains positive on daily chart. And I still expect to see gains twd 1378 and possibly higher before this upmove is over.
On the downside, a move below 1250 negates, signals a decline twd 1210 is likely under way....
Strategy: Holding long from 1267 is favored. Stop=below 1248. Target=1400
- English (UK)
- English (India)
- English (Canada)
- English (Australia)
- English (South Africa)
- English (Philippines)
- English (Nigeria)
- Deutsch
- Español (España)
- Español (México)
- Français
- Italiano
- Nederlands
- Português (Portugal)
- Polski
- Português (Brasil)
- Русский
- Türkçe
- العربية
- Ελληνικά
- Svenska
- Suomi
- עברית
- 日本語
- 한국어
- 简体中文
- 繁體中文
- Bahasa Indonesia
- Bahasa Melayu
- ไทย
- Tiếng Việt
- हिंदी
US Stock Indices - Short-Term Outlook
Published 01/16/2012, 12:15 AM
Updated 05/14/2017, 06:45 AM
US Stock Indices - Short-Term Outlook
Nasdaq 100
Latest comments
Loading next article…
Install Our App
Risk Disclosure: Trading in financial instruments and/or cryptocurrencies involves high risks including the risk of losing some, or all, of your investment amount, and may not be suitable for all investors. Prices of cryptocurrencies are extremely volatile and may be affected by external factors such as financial, regulatory or political events. Trading on margin increases the financial risks.
Before deciding to trade in financial instrument or cryptocurrencies you should be fully informed of the risks and costs associated with trading the financial markets, carefully consider your investment objectives, level of experience, and risk appetite, and seek professional advice where needed.
Fusion Media would like to remind you that the data contained in this website is not necessarily real-time nor accurate. The data and prices on the website are not necessarily provided by any market or exchange, but may be provided by market makers, and so prices may not be accurate and may differ from the actual price at any given market, meaning prices are indicative and not appropriate for trading purposes. Fusion Media and any provider of the data contained in this website will not accept liability for any loss or damage as a result of your trading, or your reliance on the information contained within this website.
It is prohibited to use, store, reproduce, display, modify, transmit or distribute the data contained in this website without the explicit prior written permission of Fusion Media and/or the data provider. All intellectual property rights are reserved by the providers and/or the exchange providing the data contained in this website.
Fusion Media may be compensated by the advertisers that appear on the website, based on your interaction with the advertisements or advertisers.
© 2007-2025 - Fusion Media Limited. All Rights Reserved.
