Nasdaq 100: Nasdaq 100:
2355.32
Short-Term Trend: sideways
Outlook:
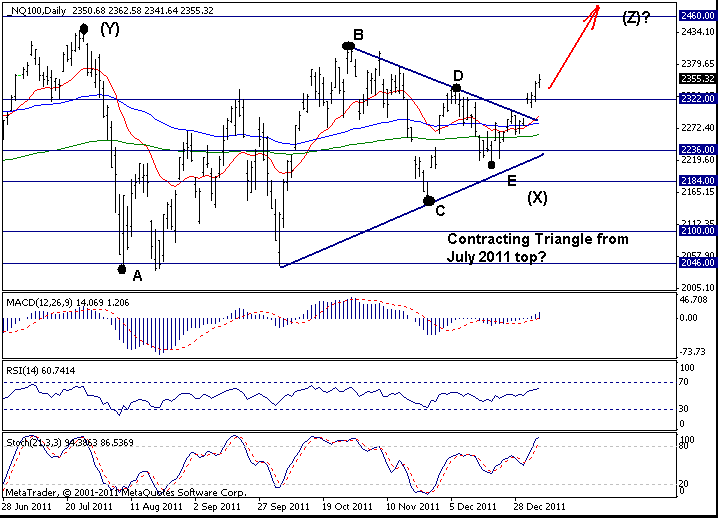
Theoretically the trend on the daily chart is still sideways as the prices remain below the important resistance at 2400. But the last week's price action is a positive sign and signals that this market is likely ready to break abv that level (2400) and to head to new recovery highs. So, the long side is favored right now.
On the downside, a move below the 2300 support will be something we don't want to see if the market is in uptrend, so protective stops can go below that level....
Strategy: Longs can be favored here against 2290.
S&P500:

S&P500:
1277.47
Short-Term Trend: sideways
Outlook:
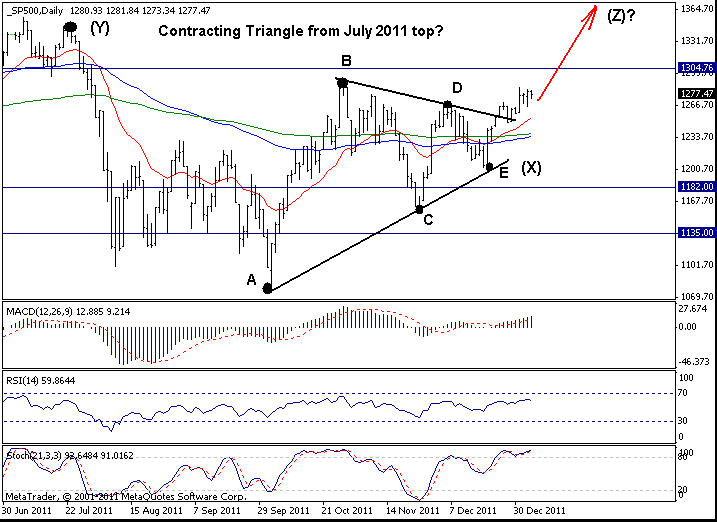
The market rallied last Tuesday (the 1st trading day of the year) and then spent the rest of the time trading sideways. Right now, the daily chart is quite constructive but a move abv 1290/1300 is needed to confirm an upside breakout of the Triangle shown on the chart above has occured. In this case, a rally twd 1378 and then to 1400 will be expected.
On the downside, below 1250 negates, signals another decline twd 1220/10....
Strategy: Holding long from 1267 is favored. Stop=below 1248. Target=1400
