Nasdaq 100:
2271.91
Short-Term Trend: sideways
Outlook:
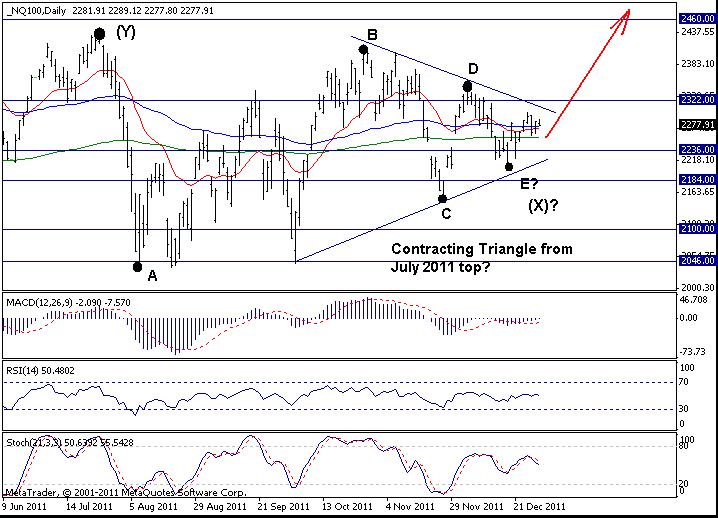
The weekly chart is a bit positive, but the daily chart right now is dead neutral. There is a clear Contracting Triangle on the chart and soon the market will undergo a big move up or down. As the way I see it, this Triangle is more likely a bullish one and eventually a powerful move up will develop. A rally abv 2400 will confirm this view.
If, however, the prices move below 2150, the Triangle will be considered bearish and weakness twd at least 1960 will be expected in this case. Right now I favor the upside here, but objectively speaking the daily chart is simply neutral.
Strategy: Stand aside.
S&P500:
S&P500: 1257.91
Short-Term Trend: sideways
Outlook:
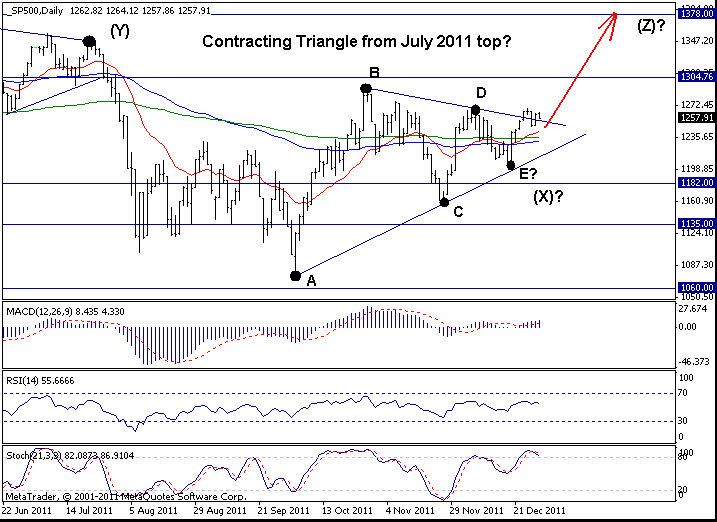
One week ago I favored a long position if the 1267 level was taken out. That happened, but there was no follow through higher. Still, there is a chance that the index will rally in the first week of 2012 and will confirm the bullish breakout. A rally abv 1290/1300 is needed to confirm the presented wave count on the chart above. If however, the index fails below 1230, a faster move down may develop from the faile move up. The confidence is not big, but I slightly favor the bullish case as indicated in our strategy below.
Strategy: Holding long from 1267 is favored. Stop=below 1230. Target=1400
