Nasdaq 100:
2287.47
Short-Term Trend: sideways
Outlook:
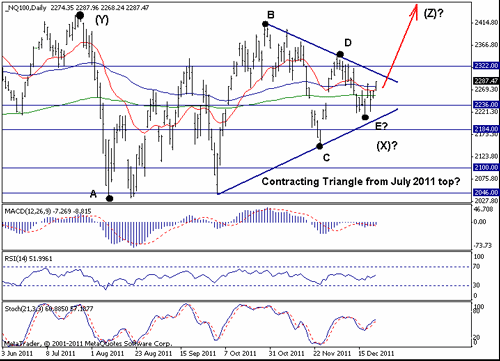
The price action last week was quite positive as the bulls managed to hold the prices well above the late November low. As result, the Contracting Triangle idea from the July 2011 top seems more and more likely and a move abv 2343 will further solidify the bullish case. To confirm that a larger-degree advance twd 2460 and 2544 is under way though, we need to see a move abv 2400 level.
On the downside, the key level remains the Nov low at 2150 and if the market breaks below there, the ST and MT picture will become quite bearish.
Strategy: Stand aside.
S&P500:
S&P500: 1265.42
Short-Term Trend: sideways
Outlook:
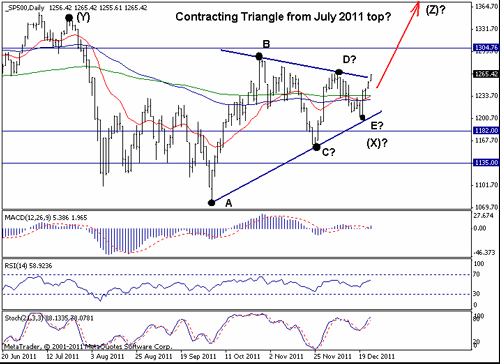
A week ago I discussed two possible scenarios for the correction from the July 2011 top: a Contracting Triangle and a Diametric. The strong rally last week speaks firmly in favor of the Contracting Triangle scenario and if we see a break abv 1267 (just 2 pts abv the last week's close), the bullish case will be further solidified. To confirm the count on the chart above though, we need a move abv the 1290/1300 level. In this case, a rally twd 1400 will become highly likely.
On the downside, the key level remains at the Nov low (1159) and only a move below there will turn the daily chart bearish.
Strategy: Longs favored on break of 1267. Stop=below 1230. Target=1400
