Nasdaq 100:
2302.25
Short-Term Trend: sideways
Outlook:
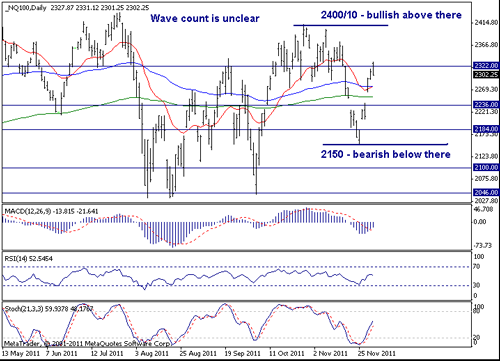
Last week's rally was something we didn't expect at all. After a positive news on Monday, the market gapped up and the market rallied. But usually such news-inspired rallies quickly fade out. In fact I have never seen the market to reverse its trend from down to up on a positive news. But the market gapped up a lot on Wednesday and the previous downtrend was completely negated. Now, the wave count is a mess here. We are back at the uncertainty if the entire rally from the Mar 2009 low is over or not. The only confidence that I have is that if the market moves abv 2400/10, the daily trend will be bullish and that will indicate the rally from the Mar 2009 low is still intact. On the other hand, a decline below 2150 will be bearish. As long as between 2150 and 2400, the outlook is neutral.
Strategy: Stand aside.
S&P500:
S&P500: 1244.96
Short-Term Trend: sideways
Outlook:
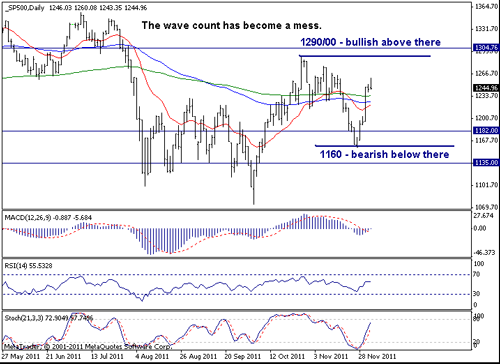
Unexpectedly the market rallied last week and thus negated the previous downtrend. The very short-term outlook has acually shifted on the upside but until the 1290/00 level is taken out, the daily chart is actually neutral. A move abv 1290/00 will be a clear sign of strength and it will indicate that the rally from the Mar 2009 low is still unfolding. On the downside, a move below 1160 will be bearish. If the market breaks abv 1300 or below 1160, the clarity will return and I will put labels on the chart. Right now, there is no need to label the waves as the confidence is low.
Strategy: The prev. hypothetical short was stopped out. Stand aside.
