Imports have slowed down compared to levels earlier this year, but are still up by nearly one-fifth through the first 10 months of the year.
According to an American Iron and Steel Institute (AISI) report earlier this week, quoting preliminary U.S. Census Bureau data, steel imports through October are up 19.4% compared with the same time frame last year.
The U.S. imported a total of 3,119,000 net tons (NT) of steel in October 2017, relatively unchanged from the previous month. In addition, about 2,493,000 (NT) of finished steel came in, down about 0.4% from final September data.
In the year-to-date (YTD), however, through 10 months of 2017, total and finished steel imports were 32,850,000 NT and 25,449,000 NT — up 19.4% and 15.4% respectively, compared with the first 10 months of 2016.
Market Share Holds Steady
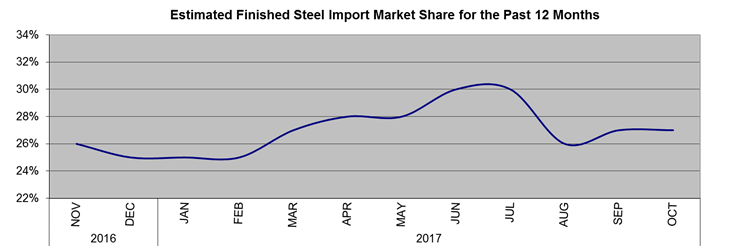
The steel import market share for October held at around 27%, relatively unchanged from the previous month.
Source: AISI
Import market share for the YTD is 28%, according to the report.
The import market share for the year peaked in June when it crested the 30% mark before dipping down to 26% in August.
Imports by Product
Several products posted significant import increases in October.
In October, products posting percentage increases from the previous month included: wire rods (up 32%), cut lengths plates (up 27%), plates in coils (up 23%) and standard pipe (up 10%).
In the YTD, oil country goods (up 231%), line pipe (up 68%), standard pipe (up 44%), mechanical tubing (up 34%), cold rolled (up 26%), sheets and strip all other metallic coatings (up 25%), hot rolled bars (up 21%) and sheets and strip hot dipped galvanized (up 17%) have all posted sizable increases.
South Korea Leads the Way
By country, South Korea once again led the way in terms of steel exports to the U.S.
South Korea sent 372,000 NT to the U.S. in October, up 14% from its September total. Behind South Korea in export volume were: Germany (156,000 NT, up 2%), Taiwan (122,000 NT, up 2%), Turkey (112,000 NT, down 7%) and Brazil (89,000 NT, down 19%).
As for the YTD, Taiwan has posted the largest percentage increase, with its 1,148,000 NT representing a 35% surge from last year’s total through 10 months.
Other YTD totals include: South Korea (3,328,000 NT, up 2% versus the same period in 2016), Turkey (2,065,000 NT, down 1%), Japan (1,307,000 NT, down 17%) and Germany (1,160,000 NT, up 14%).

