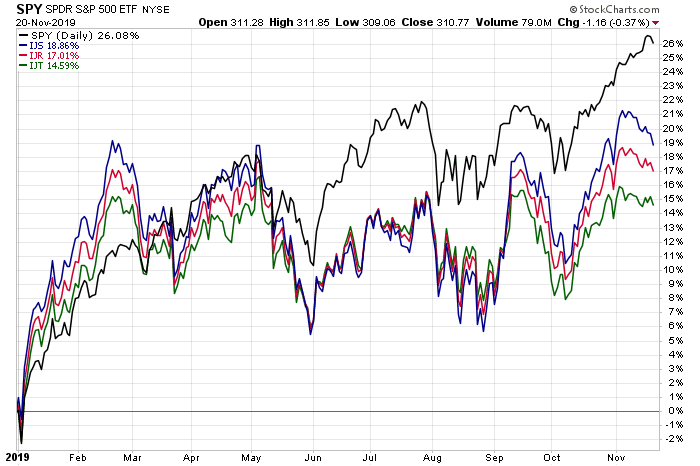
Advocates of small-cap equities keep talking about the possibility of a revival for these shares, but year-to-date results suggest otherwise, based on a set of exchange-traded funds.
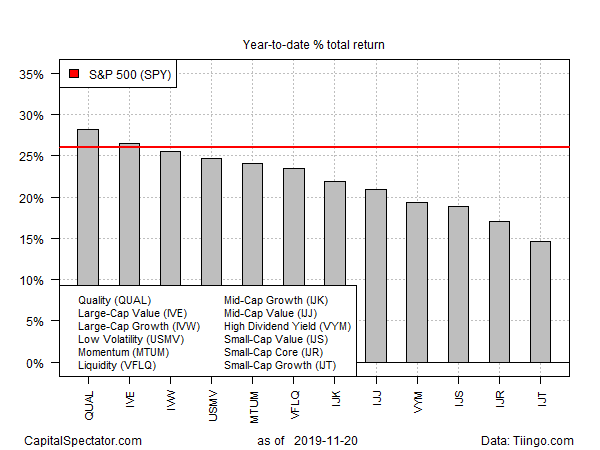
Three flavors of small-cap stocks remain well behind the usual suspects that track large caps, including SPDR S&P 500 (NYSE:SPY). This year’s best small-cap performer on our list — iShares S&P Small-Cap 600 Value (NYSE:IJS) – is up 18.9% so far this year through Nov. 20. That’s a solid performance, except when you compare it to SPY’s 26.1% year-to-date surge.

The strongest performer this year among a set of US equity factors is iShares Edge MSCI USA Quality Factor (NYSE:QUAL), which Morningstar classifies as a large-cap portfolio. At the moment, QUAL’s 2019 gain is a stellar 28.2%.

Small caps, by comparison, have trouble competing with the big-cap rally. That doesn’t stop speculation that companies in the lesser realm of capitalization will soon enjoy a revival. Last week, for example, a MarketWatch.com column explored the case for expecting small stocks to overcome large-cap leadership. Kristina Hooper, chief global market strategist at Invesco, noted that “small cap performance is all about expectations for economics growth, the reduction of recession fears, the steepening of the yield curve and the bottoming out of sentiment with U.S.-China trade in August.”
MarketWatch went on to surmise:
All of these factors have underpinned a renewed optimism among investors that the current economic expansion has room to run, benefitting small cap stocks that are perceived as more sensitive to the economic cycle, as well as “value” stocks that are inexpensive relative to an intrinsic measure of their worth, like price-to-book or price-to-cash-flow.
Perhaps, but a week later the small-cap renaissance remains on hold. The iShares Core S&P Small-Cap (NYSE:IJR), for example, is well behind SPY this year. Even over the past month, IJR’s 2.8% rise pales next to SPY’s 4.3% gain.

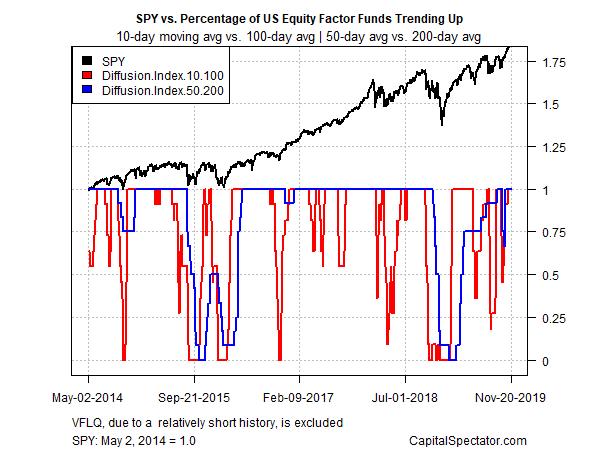
In terms of absolute performance, however, US equity factor results overall remain firmly in positive terrain. Profiling all the factor ETFs cited above shows that perfection prevails in the cause of upside bias, based on a set of moving averages. The first metric compares each ETF’s 10-day moving average with the 100-day average — a proxy for short-term trending behavior (red line in chart below). A second set of moving averages (50 and 200 days) offers an intermediate measure of the trend (blue line). The indexes range from 0 (all funds trending down) to 1.0 (all funds trending up). Based on data through yesterday’s close, bull momentum reigns supreme.
