The US government moved inexorably down to the wire and over the cliff, but meanwhile there was better news out of Italy and Japan. That leaves the US as the biggest train wreck in town for now, and is likely to weigh on the dollar while boosting JPY and CHF. The picture is mixed for the high-beta currencies: lower US interest rates should in theory boost them, but risk aversion is likely to weigh on them.
Political analysts say that a shutdown of two to five days is likely, but one to two weeks is entirely possible. Shutdowns are in fact quite normal in the US. The Federal government has closed 17 times since 1976, although this is the first time it’s happened since 1995. Usually US Treasuries are the ultimate “safe haven” investment, and even during a government shut-down I would expect US bond yields to decline, indeed, the savings that result from less government spending make Treasuries more attractive! Moreover, a shutdown makes it more likely that the Fed will continue with its asset purchases through the October meeting. For example, the implied interest rate on longer Fed Funds futures was down 3 bps yesterday, possibly as a result of such thinking. Lower rates could help to boost risk assets around the world and prove positive for high-beta, relatively high interest rate currencies such as the AUD and NZD. Historically, the dollar has declined ahead of shutdowns and recovered afterwards so if the debt ceiling problem is resolved, there may be only a delay, not a disruption, of the recent USD rally.
What is new this time though is the struggle to raise the debt ceiling, which until the advent of the Tea Party was a routine event that attracted no attention. The risk of the shutdown segueing into the fight over the debt ceiling, the ultimate “third rail” of US politics, adds an unpredictable element to the crisis. As far as I know it has never happened that the US has been unable to pay interest on its debt before.
It remains to be seen whether US Treasuries and the USD will still be a safe haven if there is a risk that the government may not be able to make its coupon payments. If that were to happen, it could have a devastating effect on the perceived creditworthiness of the US government, add a risk premium that would push US interest rates permanently higher, thereby lowering the US growth rate, and reduce the dominance of the USD as the world’s reserve currency. The possibility of such an intensive “risk off” scenario is likely to boost JPY and CHF in the first instance and to weigh on the growth currencies, although we should note that as one of the few AAA-countries left, Australia could benefit from the crisis after all. EM currencies remain vulnerable to risk aversion and a flight to safety if the US hits the debt ceiling. BRL, ZAR, INR, TRY and IDR – dubbed the “fragile five” by the financial world – are probably the most vulnerable currencies.
In Italy, there are reports that former PM Berlusconi is considering softening his stance against the government after some 20 senators from his PDL party may break away unless he does so. PM Letta would need at least 24 votes from PDL or 5-Star Movement members to survive tomorrow’s no-confidence vote. The report has diminished the risk from Italy and left the US as the most troubled nation – may boost EUR/USD.
In Japan, the tankan far exceeded expectations, with the diffusion index (DI) for large manufacturers rising to 12 in September from 4 in June. This exceeded market expectations of 7 and was even higher than manufacturers’ own predictions in June that it would rise to 10. Unfortunately they forecast that it will ease 1 point to 11 in Q4, but that doesn’t seem to be weighing on sentiment as the survey showed improvement in many sectors, both in manufacturing and non-manufacturing. The stock market is up slightly on the news, waiting to hear from PM Abe on his plans for the consumption tax. If he raises the tax to 8% from 5% and offsets it for the first year at least with a fiscal stimulus package, as expected, this should prove fairly neutral or even positive for USD/JPY insofar as the stock market would be likely to rally further. At the same time, I think it’s more likely that international factors, not domestic factors, will dominate JPY and the global risk aversion caused by the US government shutdown is likely to cause JPY to appreciate temporarily at least.
The Reserve Bank of Australia (RBA) held rates steady at 2.5%, as was universally expected. The key point was that the statement following the meeting said the full effects of easing up to now “are still coming through, and will be for a while yet.” That implies no need to ease further. AUD strengthened as a result. As mentioned above, it’s likely that lowered expectations for US interest rates could prove beneficial for AUD for the near future.
Following the announcement of China’s manufacturing PMI overnight 51.1, below estimates of 51.6 and up only 0.1 point from August), we have PMIs from several European countries and the US today. Italian manufacturing PMI for September is forecast to fall slightly from 51.3 to 51.1, while the UK manufacturing PMI is expected to rise slightly to 57.5 in September i from 57.2. The market expects no change in the final PMIs for France, Germany and the EU as a whole compared to their preliminary estimates, which were 49.5, 51.3 and 51.1, respectively. The EU preliminary figure was down from 51.4 in August, so no upward revision could prove EUR-negative. In the US, the Institute of Supply Management (ISM) manufacturing PMI is coming out today along with the Markit global PMIs. The more closely watched ISM PMI is forecast to fall to 55.1 in September from 55.7, which added to the fiscal shenanigans that are threatening US growth, could send USD lower.
The Market
EUR/USDEUR/USD" title="EUR/USD" src="https://d1-invdn-com.akamaized.net/content/pic11486f845bf4e97ee796f13a5ab04ae1.png" height="813" width="1731" />
The EUR/USD moved higher, covering yesterday’s opening gap. The pair has remained in a short-term sideways range between the support level of 1.3461 (S1) and the resistance of 1.3564 (R1) since Sept. 18th. The MACD oscillator lies slightly above zero, shifting the odds for an upward break of the 1.3564 (R1) ceiling. However, in my opinion, we should wait for the clear break out of the sideways range in order to determine the forthcoming direction of the price.
• Support is identified at 1.3461 (S1), 1.3400 (S2) and 1.3321 (S3) respectively.
• Resistance levels are the level of 1.3564 (R1), followed by 1.3655 (R2) and 1.3706 (R3) (daily chart).
EUR/JPYEUR/JPY" title="EUR/JPY" src="https://d1-invdn-com.akamaized.net/content/pic76f76771e0171cbea12299766ecfe5b7.png" height="813" width="1731" />
The EUR/JPY surged the European evening yesterday, also covering the bearish gap and breaking above the 132.70 barrier (yesterday’s resistance). At the time of writing the rate lies between the aforementioned level and the resistance of 134.00 (R1), where, if the bullish bias continues, I expect the rate to face strong resistance. The overall trend of the pair remains an uptrend, since the price is still trading into the upward sloping channel and the 20-period moving average lies above the 200-period moving average.
• Support levels are at 132.70 (S1), followed by 131.92 (S2) and 130.96 (S3).
• Resistance is identified at 134.00 (R1), followed by 134.66 (R2) and 135.63 (R3). The latter one is found from the weekly chart.
GBP/USD GBP/USD" title="GBP/USD" border="0" height="809" width="1729" />
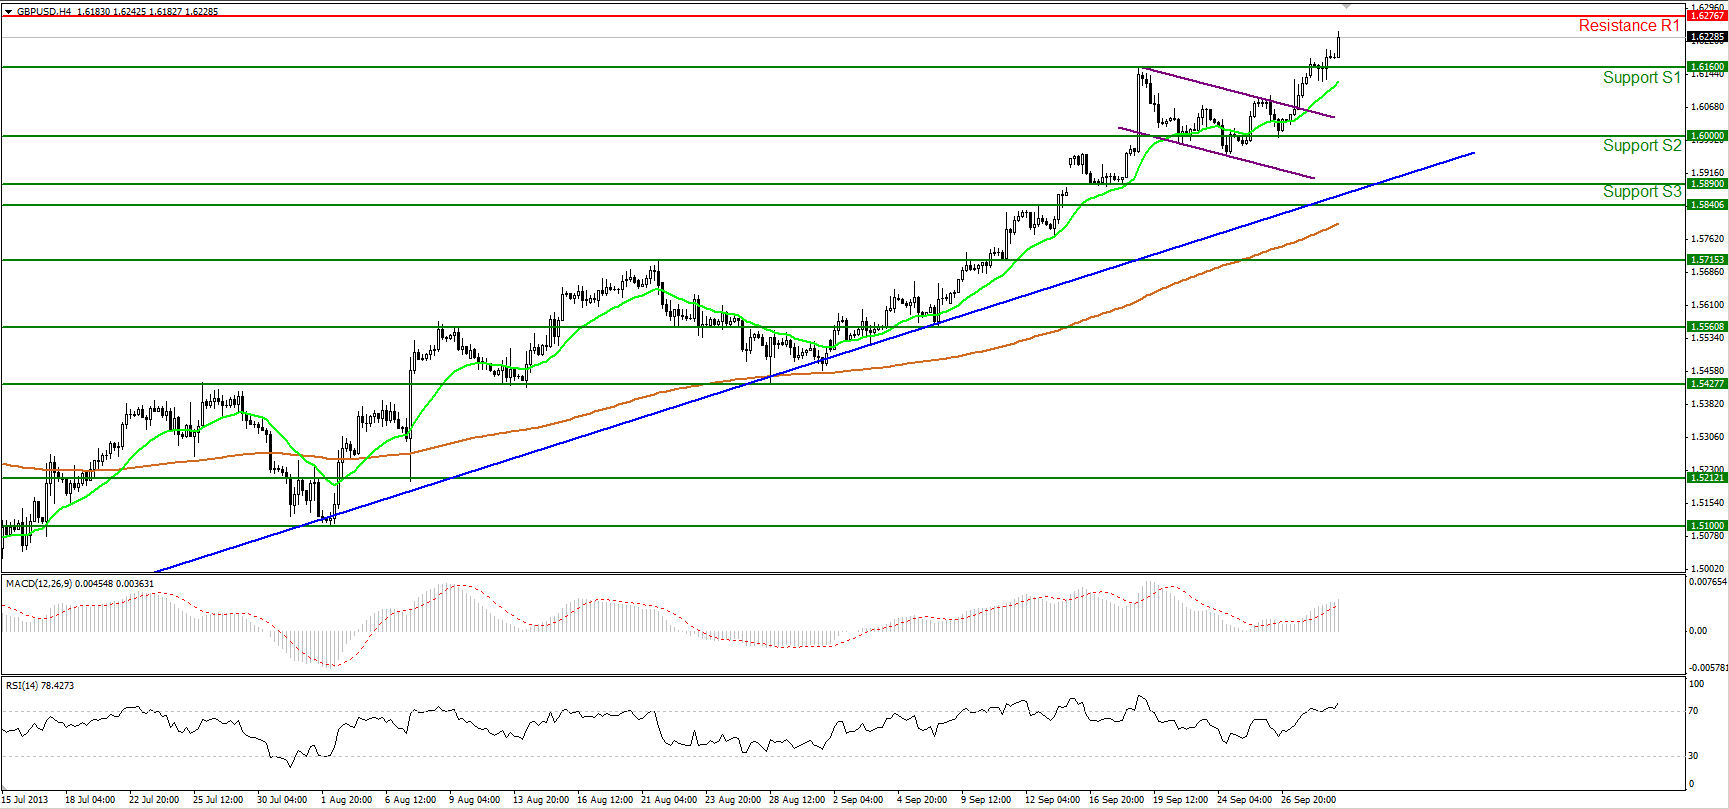
The GBP/USD moved higher after the completion of a flag continuation pattern, breaking the 1.6160 hurdle (yesterday’s resistance). During the European morning the pair is heading towards the next resistance at 1.6276 (R1), where a clear penetration should target areas we last saw at the beginning of January. Other technical studies favor the aforementioned scenario, since the rate is trading above both the 20- and 200-period moving averages and the MACD lies above both the zero and the trigger lines.
• Support levels are identified at 1.6160 (S1), 1.6000 (S2) and 1.5890 (S3).
• Resistance is found at 1.6276 (R1), followed by 1.6376 (R2) and 1.6470 (R3). The latter two are found from the weekly chart.
Gold
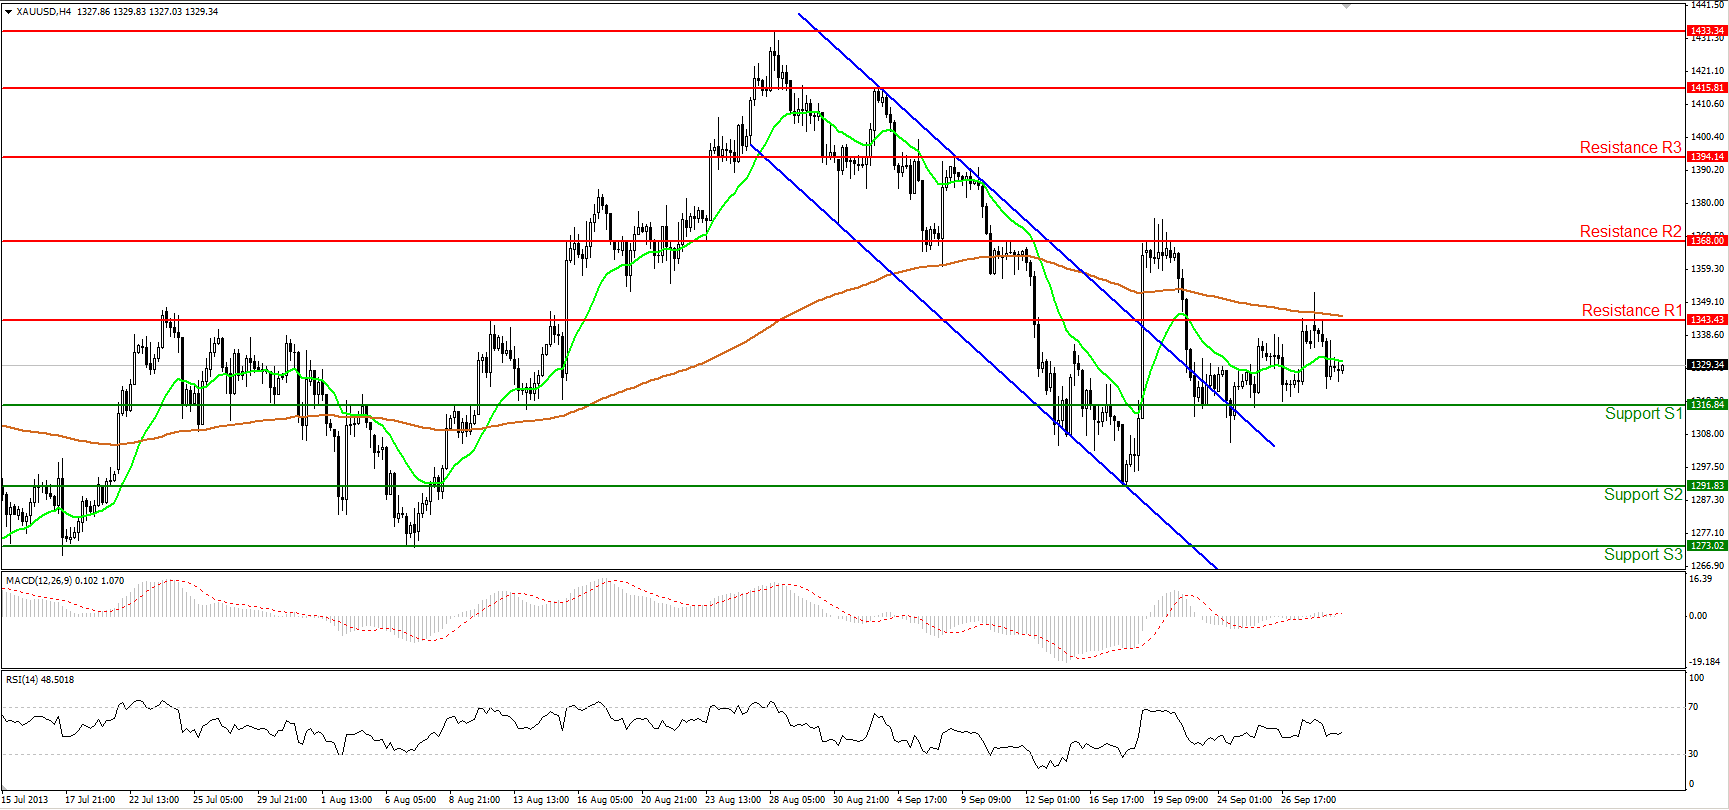
Gold moved lower yesterday, confirming that it is slowly losing its status as a safe-haven asset. The precious metal is trading in a consolidative path between the 1316 (S1) and 1343 (R1), which is also confirmed by the neutral values of both the MACD and the RSI oscillators. Therefore, I believe we should wait for a clear violation of either level in order to have a better picture of Gold’s forthcoming direction.
• Support levels are at 1316 (S1), followed by 1291 (S2) and 1273 (S3).
• Resistance is identified at the 1343 (R1) level, followed by 1368 (R2) and 1394 (R3).
Oil
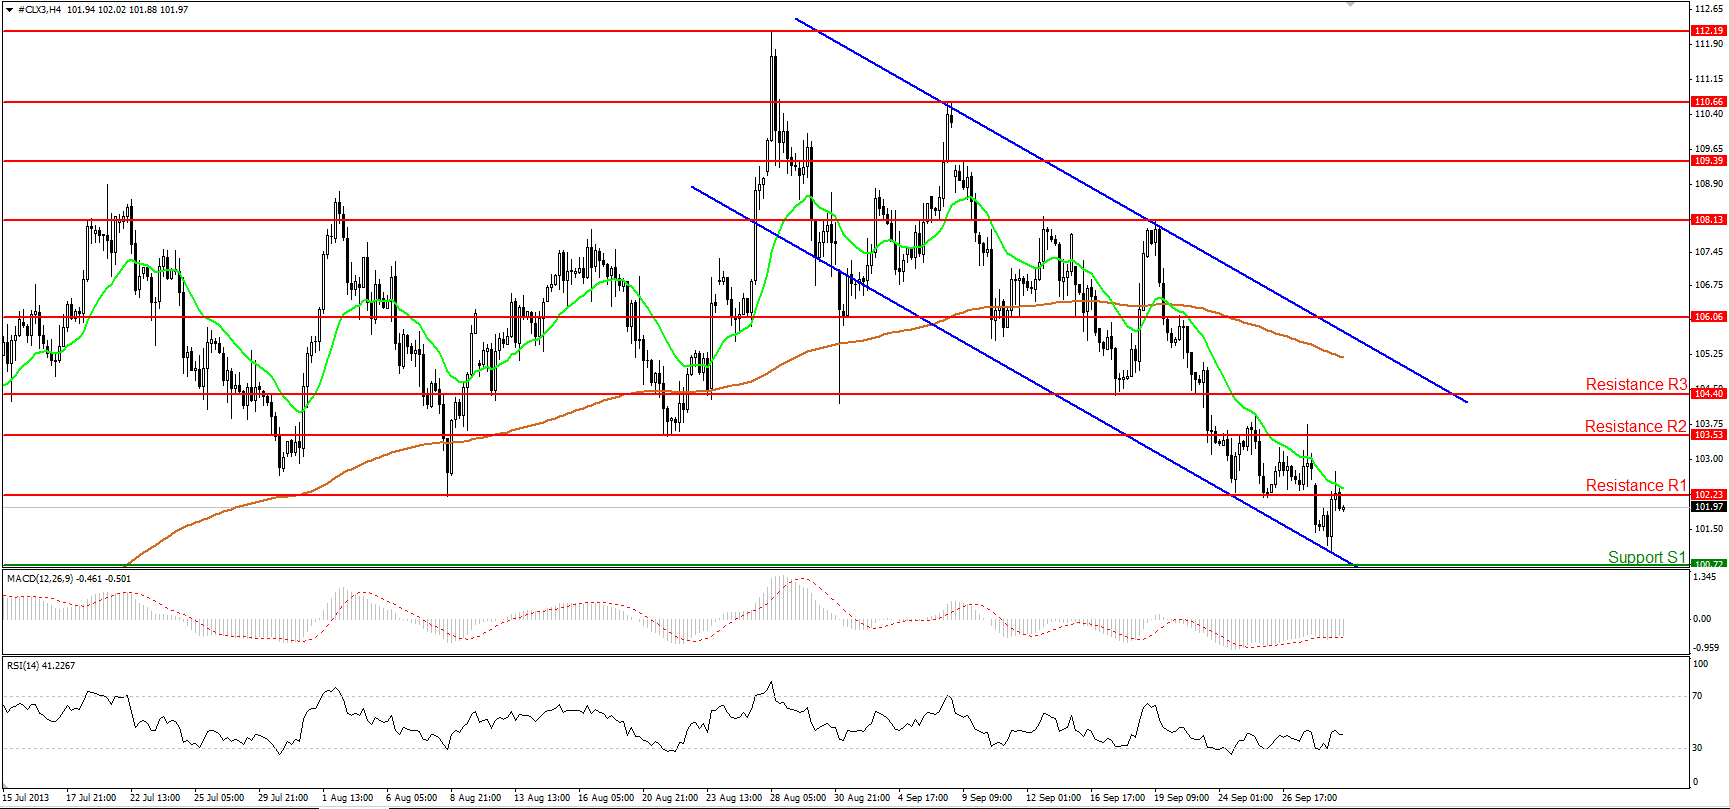
WTI moved higher to test once more the critical level at 102.23 (R1). The price found resistance at that level and is currently trading slightly below it, confirming that the bears are ready to extend their moves towards the 100.72 (S1) support. Moreover, WTI lies below both the 20- and 200- period moving averages and alongside with the negative value of MACD, they increase the probabilities for the continuation of the downward bias.
• Support levels are at 100.72 (S1), 99.18 (S2) and 98.00 (S3). Identified on the daily chart.
• Resistance levels are at 102.23 (R1), followed by 103.53 (R2) and 104.40 (R3).
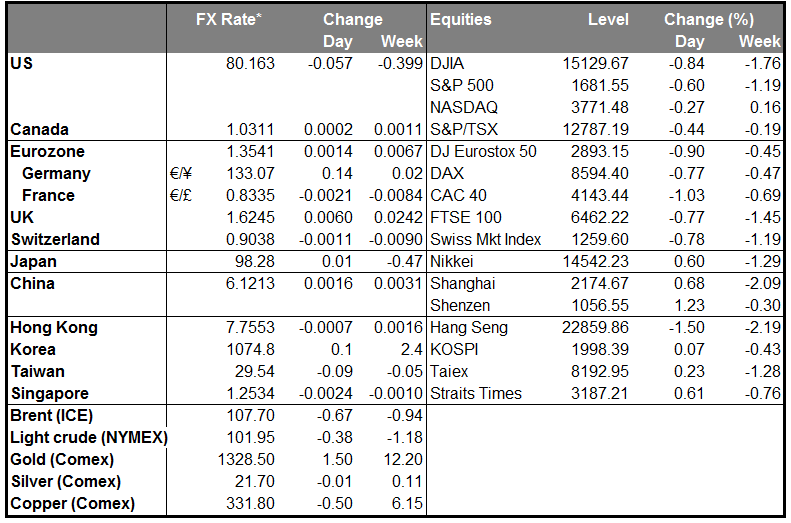
BENCHMARK CURRENCY RATES - DAILY GAINERS AND LOSERS
MARKETS SUMMARY:


