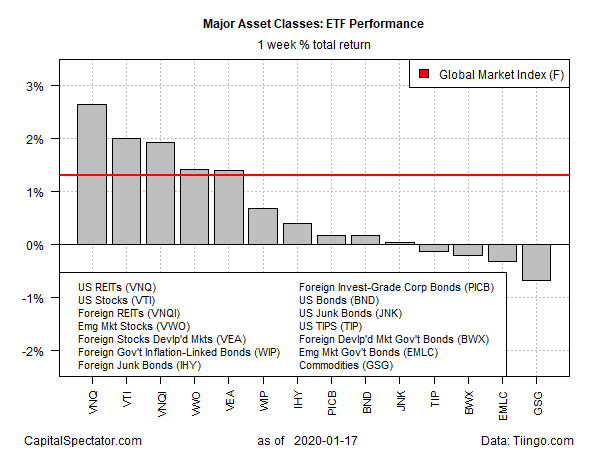
Real estate investment trusts (REITs) in the U.S. topped last week’s returns for the major asset classes and ended the week at a record high, based on a set of exchange-traded funds, as of Friday, Jan. 17.
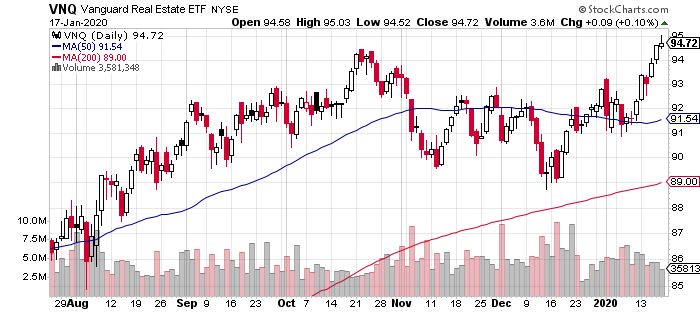
After a mild correction late last year, Vanguard Real Estate (NYSE:VNQ) started to rally in mid-December and has been trending up ever since. The fund surged 2.6% last week, marking its fourth consecutive weekly gain.

Last week’s second-best performer: U.S. stocks, which also rose to a new high at the end of trading on Friday, based on Vanguard Total Stock Market (NYSE:VTI). The ETF has been on a near-non-stop run higher since October: VTI has posted weekly gains in 13 of the past 15 weeks.
The deepest setback last week unfolded in broadly defined commodities. The iShares S&P GSCI Commodity-Indexed Trust (NYSE:GSG) fell for a second week, shedding 0.7%.
The Global Market Index (GMI.F) rose for a second week. This unmanaged benchmark that holds all the major asset classes (except cash) in market-value weights gained 1.3% last week—the index’s best weekly advance in five months.

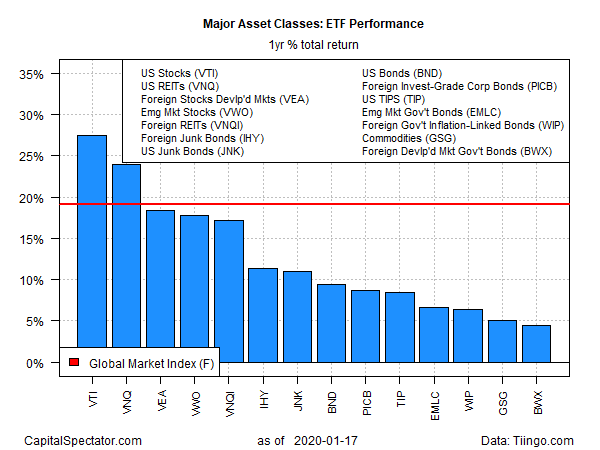
For the one-year trend, U.S. stocks remain the top performer. Vanguard Total Stock Market (VTI) is up a strong 27.5% on a total return basis over the past 12 months.
U.S. REITs are a close second, posting a 24.0% total return for the trailing one-year window at last week’s close.
All the major asset classes are posting one-year gains at the moment. The softest advance: SPDR Bloomberg Barclays (LON:BARC) International Treasury Bond (NYSE:BWX), which is up a relatively weak 4.5% over the past year.
GMI.F’s one-year total return at Friday’s close: 19.1%, which beats all but two of the major asset classes.


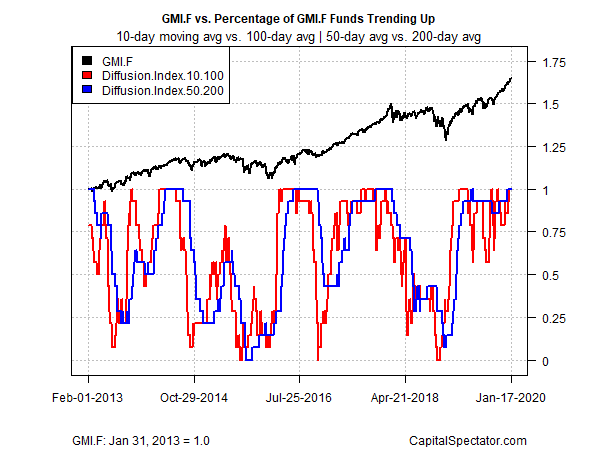
Profiling all the ETFs listed above through a momentum lens continues to reflect a positive, across-the-board trend. The analysis is based on two sets of moving averages. The first compares the 10-day moving average with its 100-day counterpart — a proxy for short-term trending behavior (red line in chart below). A second set of moving averages (50 and 200 days) represents an intermediate measure of the trend (blue line). At the end of last week, all the funds representing the major asset classes were trending positive.
