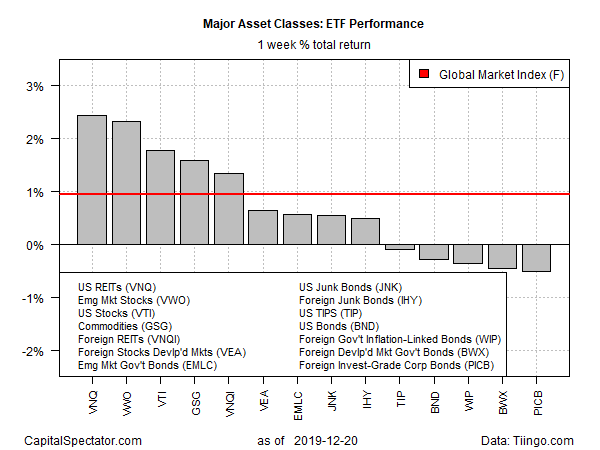
Real estate shares in the U.S. and equities in emerging markets topped last week’s returns for the major asset classes, based on a set of exchange-traded funds. The main losers for the trading week through Friday, Dec. 20: foreign bonds.
Vanguard Real Estate ETF (NYSE:VNQ) posted its first weekly rise this month with a strong 2.4% rally. Despite the gain, the fund is still well below its previous peak, set in October. Traders will be watching how VNQ performs in the final sessions of the year for clues on whether the ETF will regain its bullish momentum in 2020 – momentum that was front and center for most of this year until VNQ began to stumble in October.
Stocks in emerging markets were a close second in last week’s list of top-performing asset classes. Vanguard FTSE Emerging Markets (NYSE:VWO) rallied 2.3%, marking the third straight weekly advance and lifting the ETF to its highest close since April.
Most of the weakness in global markets last week was concentrated in bonds outside the Invesco International Corporate Bond ETF (NYSE:PICB) shed the most on our list of proxy ETFs with a 0.5% decline. Despite the setback, the fund has been rallying over the last two months and remains close to a 1-1/2 year high.

The upside bias in most markets continued to lift the Global Market Index (GMI.F) — an unmanaged benchmark that holds all the major asset classes (except cash) in market-value weights. GMI.F rose 0.9% for the five trading sessions through Dec. 20 — the index’s fourth straight weekly gain.
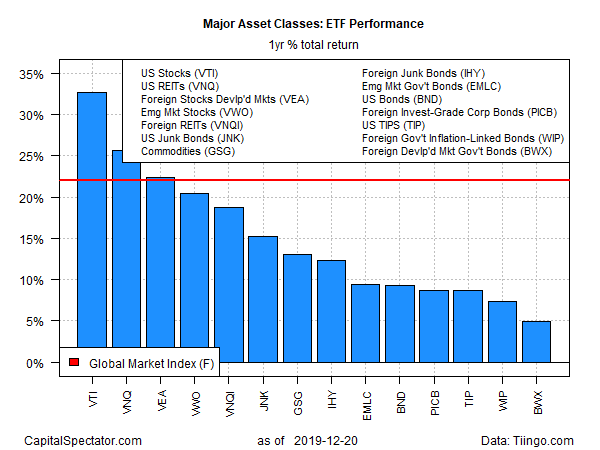
For the one-year trend, US stocks remain the top performer. Vanguard Total Stock Market (VTI) is up a sizzling 32.7% on a total return basis over the past 12 months.
Note that all of the major asset classes are posting gains for the one-year window. The softest rally is in government bonds ex-US: SPDR® Bloomberg Barclays International Treasury Bond ETF (NYSE:BWX), which is ahead by 4.8% after factoring in distributions.
In a sign of 2019’s strength in markets generally, GMI.F is posting a hefty 22.1% one-year gain through last week’s close.

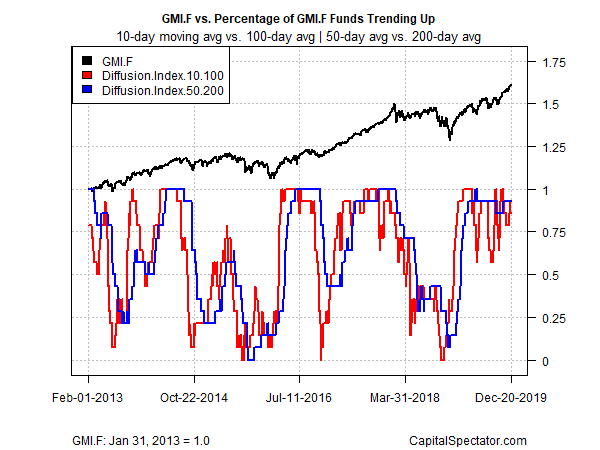
Profiling all the ETFs listed above through a momentum lens shows that a strong upside bias rolls on overall. The analysis is based on two sets of moving averages. The first compares the 10-day moving average with its 100-day counterpart — a proxy for short-term trending behavior (red line in chart below). A second set of moving averages (50 and 200 days) represents the intermediate measure of the trend (blue line). Nearly all the asset classes continue to reflect a bullish trend these days and so GMI.F’s near-term outlook remains positive.

