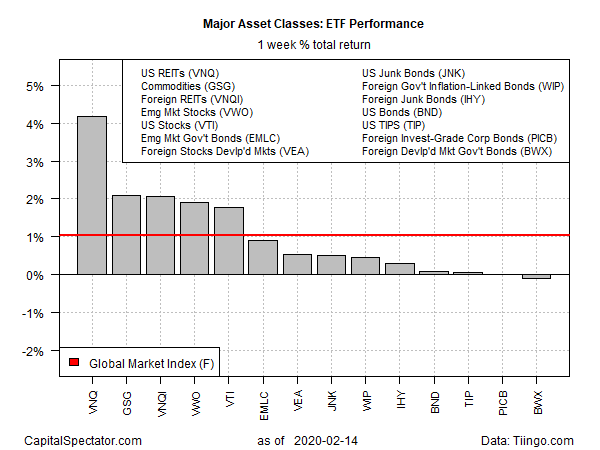
Real estate is hot – sizzling, in fact, based on last week’s trading activity. In relative and absolute terms, REITs in the US delivered a spectacular run for the trading week ended Friday (Feb. 14) — the strongest gain by far for the major asset classes, based on a set of proxy ETFs.
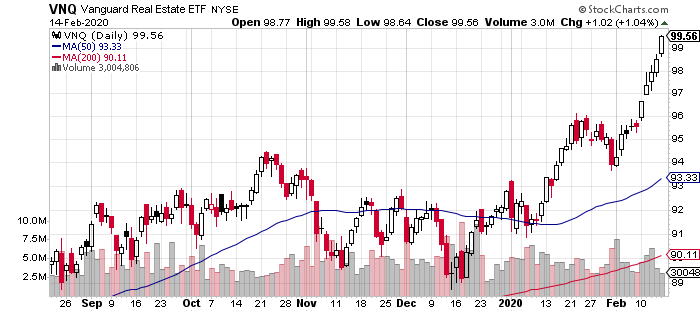
Vanguard Real Estate (NYSE:VNQ) rose 4.2%, posting the best weekly advance for the fund in more than a year. What’s the allure? A relatively high dividend yield is probably a factor. The recent decline in the benchmark 10-year Treasury yield (1.59% as of Friday) burnishes VNQ’s 3.4% trailing 12-month yield. Whatever the reason, the fund enjoyed a stellar rally last week.

VNQ left the rest of the field in the dust, but that didn’t stop several slices of the major asset classes from posting solid gains last week. Essentially vying for second place at the +2.1% mark: broadly defined commodities — iShares S&P GSCI Commodity-Indexed Trust (NYSE:GSG) — and foreign REITs/real estate — Vanguard Global ex-U.S. Real Estate (NASDAQ:VNQI).
The weakest performer last week: foreign government bonds in developed markets. SPDR Bloomberg Barclays International Treasury Bond (NYSE:BWX) lost 0.1% — the fund’s second straight weekly decline.
The Global Market Index (GMI.F) extended its current rally for a second week. This unmanaged benchmark that holds all the major asset classes (except cash) in market-value weights increased 1.0% last week.

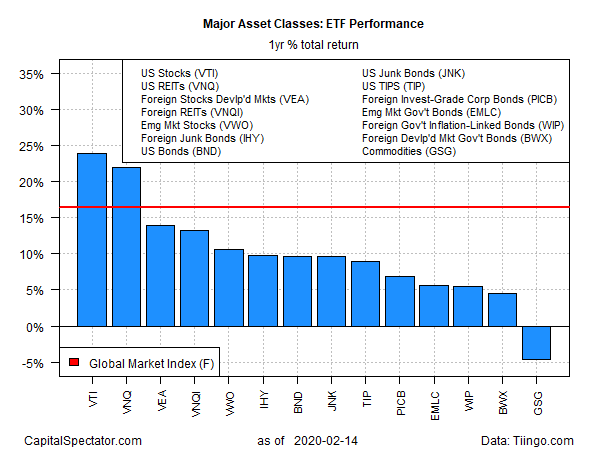
For the one-year trend, US equities remain in the lead. Vanguard Total US Stock Market (NYSE:VTI) is up 22.6% for the trailing 12-month window.
Note that in the wake of last week’s strong rally in US REITs, VNQ — the second-best one-year return for the major asset classes — is now nipping at VTI’s heels.
Meantime, broadly defined commodities continue to post the deepest and only one-year loss: GSG closed on Friday with a 4.6% decline vs. the year-earlier price.

GMI.F’s one-year total return at Friday’s close: 16.4%, trailing only US stocks and US REITs in the 12-month window.
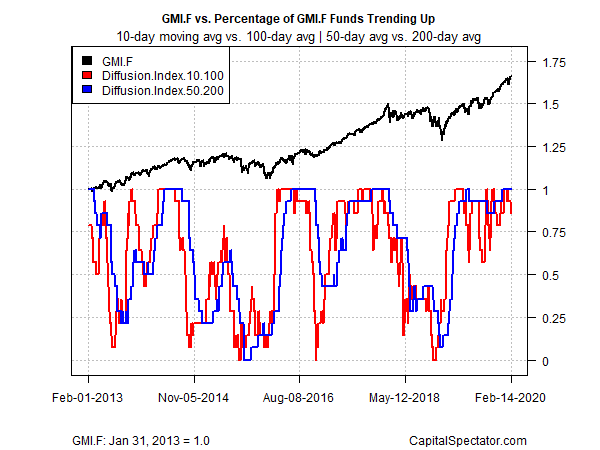
Profiling all the ETFs listed above through a momentum lens continues to reflect positive trends in most corners of the markets. Growing concern about the coronavirus may take a toll at some point, but as of Friday’s close the overall picture still indicated that a bullish posture dominated. The analysis is based on two sets of moving averages. The first compares the 10-day moving average with its 100-day counterpart — a proxy for short-term trending behavior (red line in chart below). A second set of moving averages (50 and 200 days) represent an intermediate measure of the trend (blue line).

