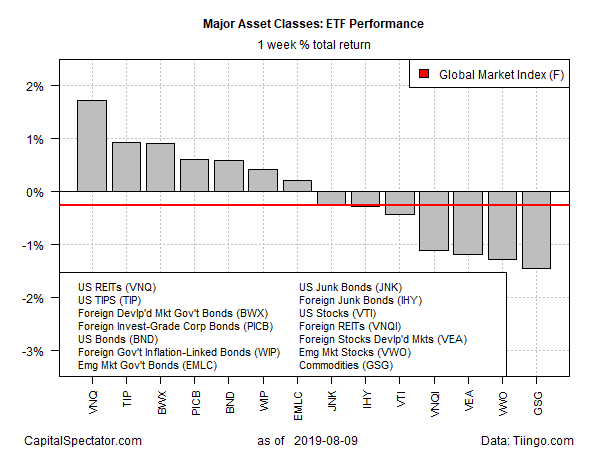
Real estate shares are on a roll. For a second week, real estate investment trusts (REITs) posted the strongest weekly gain for the major asset classes, based on performances via a set of exchange-traded funds. The leading gain is no mean feat when you consider that risk-off sentiment has returned lately and bond prices have surged.
Vanguard Real Estate (VNQ) popped 1.7% for the week of trading ended Friday, Aug. 9. The gain marks the third straight weekly advance and the second week in a row that REITs have led the major asset classes.
Last week’s second-best performer: inflation-indexed Treasuries. The iShares TIPS Bond (NYSE:TIP) rose 0.9%, delivering the fund’s best weekly advance so far this year.
Last week’s big loser: broadly defined commodities. The iShares S&P GSCI Commodity-Indexed (NYSE:GSG) slumped 1.5%. The latest decline marks the fourth straight weekly loss.
Note, however, that gold has been an outlier in the commodities space. Although the precious metal isn’t tracked in this column (it’s part of the broad definition of commodities), gold’s allure has surged lately, as last week’s 4.0% gain for SPDR Gold Shares (NYSE:GLD) attests.
Meantime, last week delivered a mild headwind for an ETF-based version of the Global Market Index (GMI.F). This unmanaged benchmark, which holds all the major asset classes (except cash) in market-value weights, slipped 0.3%.

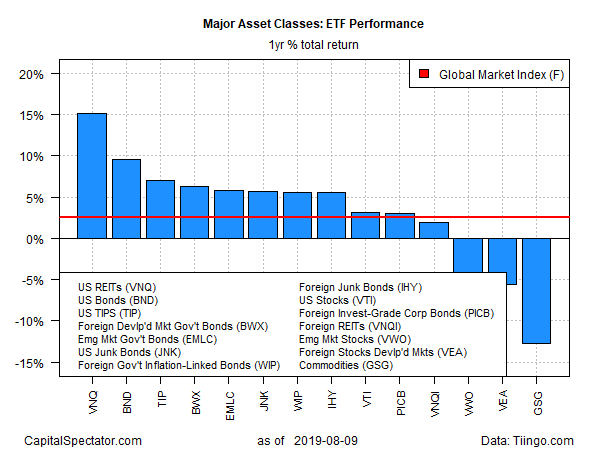
For trailing one-year returns, US REITs continue to lead. Vanguard Real Estate (VNQ) is up 15.1% over the past 252 trading days after factoring in distributions—a return that’s well ahead of the remaining major asset classes.
Meantime, broadly defined commodities continue to post the deepest shade of red for the one-year trend. GSG has lost 12.5% as of Friday’s close vs. the year-ago price.
GMI.F is holding on to a modest one-year gain, rising 2.5%.

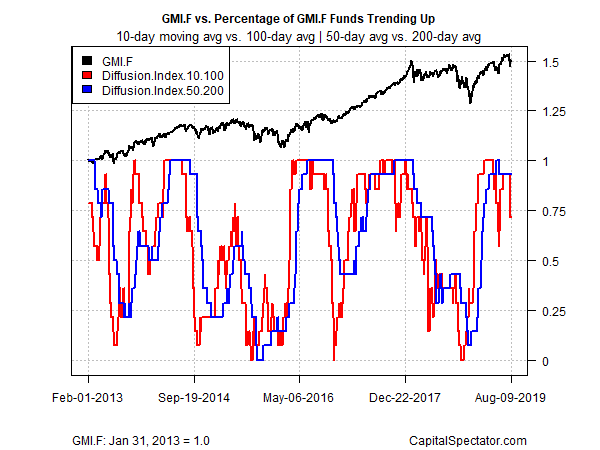
Profiling the major asset classes via a set of momentum indicators reveals a bit of weakness creeping in. The analysis is based on two sets of moving averages for the ETFs listed above. The first compares the 10-day moving average with its 100-day counterpart — a proxy for short-term trending behavior (red line in chart below). A second set of moving averages (50 and 200 days) represents an intermediate measure of the trend (blue line). As of Friday’s close, the short-term indicator fell, reflecting setbacks for several asset classes. Given the weak start to this week’s trading in foreign markets and US futures, the odds appear low for a quick rebound.

