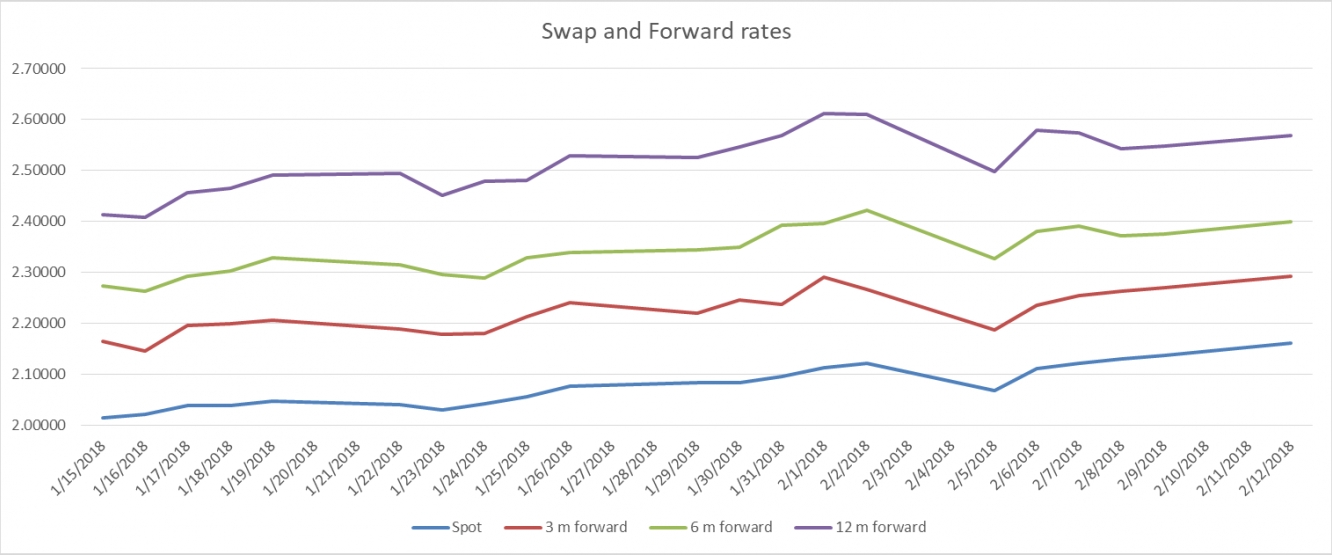
A couple of days ago we witnessed a sell-off in the stock market that drove yields down. Long-term US treasury holders had 5-15% gain, however now it seems like sell-off moved from stock to bond market. Inflation indexed 10-year US government bond increased from 0.55% on February 6 to 0.78 on February 9. Aggressive inflation pricing, however breakeven did not keep its level of 2.12% which was on February 8 and fell to 2.08%. One can conclude that even though inflation is being priced aggressively that cannot be seen in the nominal rates as perhaps real rate decreases.
3, 6 and 12 month forward rates all more or less stick to the same shape of decreasing slope after the sell-off in the stock market.
Moreover if we check the rate that shows us how much will be paid during the next year after the maturity on forward rates, basically forward rate calculation on forward rates, we would also conclude that long term yield has already reached their high limits. The idea here is to derive the slope of this forward rates and to check how this slope changes across time. For example if 1-year swap rate is 2.16 and 2 year swap rate is 2.37% the rate that we need to be paid after 1 year in order to reach the same spot rate of 2-year swap rate equals to 2.58%.
In the table below I have tenors, 3-, 6- and 12-month forward rates and colored sections, which indicates the rate defined above. As it can be seen in most cases as the tenor increases the forward rates also moves up, however the slope of this change decreases (the colored section). And based on this table regarding the 10-year swap rate change on all forward rates are below the changes related to previous two years. So in the future one can expect curve flattering in the 5-10 year area. Let’s take a look at the same issue from a different perspective.
In the table above I calculated the slope for forward rates not based on tenors but based on type of a forward rate. So let’s say 3.0628% under 10 year corresponded to 12-m forward indicates the change from 6-month forward rate to 12-month forward rate. So in the time period between 6 month from now and 12-month from now change of a 10-year swap rate is expected to be less than change in 8 or 9 year rates. Again one can expect curve flattering in the 5-10 year area.
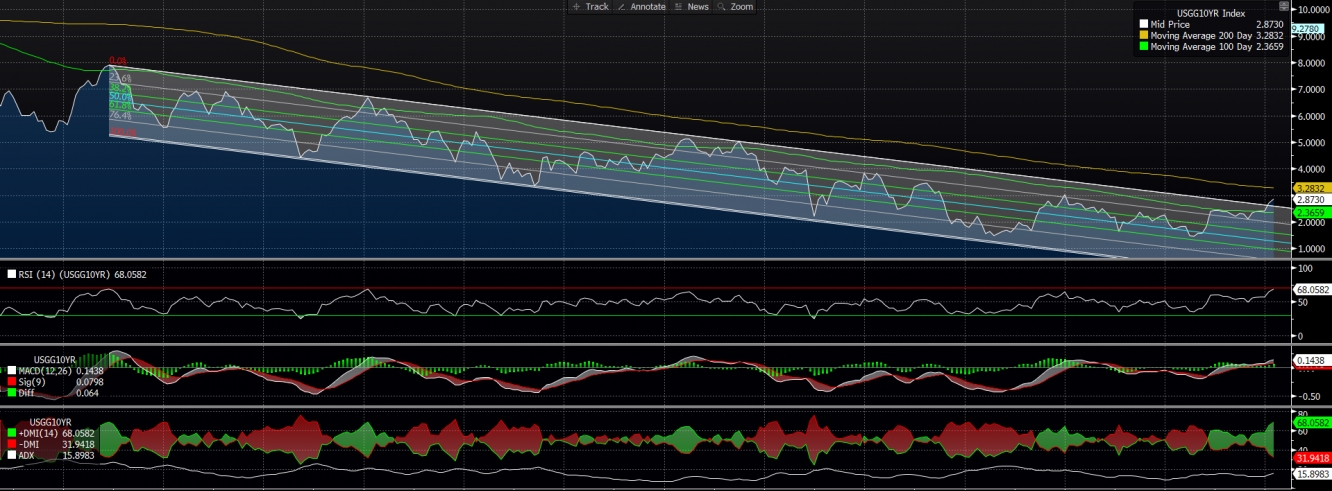
One last thing are the pivots. According to pivots 1st, 2nd and 3rd resistance levels on a 10-year US government bond are 2.69%, 2.76% and 2.82% respectively. On the other hand 1st, 2nd and 3rd support levels are 2.90%, 2.92% and 3% respectively.
Summary: Some technical indicators show that 10-year US treasury at its highest level and it is time to take long position, on 14th of February we have CPI announcement with 1.9% YOY expected, whereas it was 2.1% in December, so support from the fundamental side can also be expected. P.S. In my “2018 Outlook” article I shared a graph related to the 10-year US government bond, has the situation changed? Looks it has. But the reverse and movement back to the channel is still possible.
P.S 2. It is important to note that 10-year US Treasury note volatility spiked from 3.52 at the beginning of this year to a level above 6 in February.


