Since 17 April, the U.S. 30-Year Treasury bond rate has increased 35bps from 2.51% to 2.86%. Given the volatility in the bond rate, this represents a 1.95 sigma increase, having a 2.5% probability assuming a normal distribution. The movement is almost entirely reflected in a steepening of the yield curve as the 1-Year Treasury rate has increased only 3bps since 17 April.
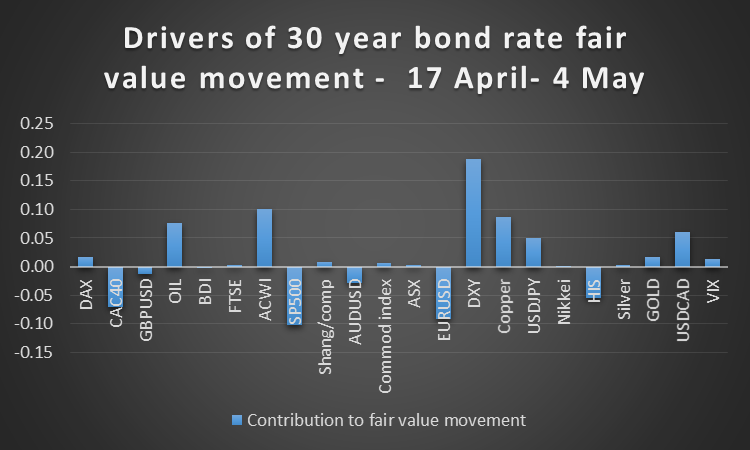
Firs, we thought we would ask – to what extent can this be explained by movements in the “fair value” of the 30-year bond rate? To answer this, we looked to our 22-variable multiple regression model of the rate, based on 6.5 years of daily price data. The drivers of the increase are shown in the graph below:

This analysis “explains” 27bps of the 35 bps movement: in summary, movements in US dollar exchange rates accounted for 17bps, stock markets: -10 bps, commodity markets: 19bps and the VIX: 1bps.
The 8bps of the bond rate increase not accounted for by our model could be interpreted as overshoot. However, correlation does not imply causality – to an unknown extent the movements shown above could be outcomes of the bond rate rise rather than causes and therefore these variables rather than the bond rate may move to close the gap.
The gap could also be in part due to the model not containing all the relevant drivers. (Technically, the model has an r-squared of 93%, which is high but leaves some of the price movement unexplained).
The fair value of the 30-year bond rate using the above model is currently 2.25%, 61 bps below the current rate. The 6.5 year low was also 2.25% (on 30 January 2015), at which time the fair value was below that level.
We have also developed a model based on a leading relationship between the MSCI All-Country World Equity Index (ACWI) and the US 30-year bond rate. This model indicates that decreases in the bond rate tend to follow periods of upward movement in the ACWI. The ACWI has strengthened in recent weeks, suggesting a downside bias in the bond rate from now.
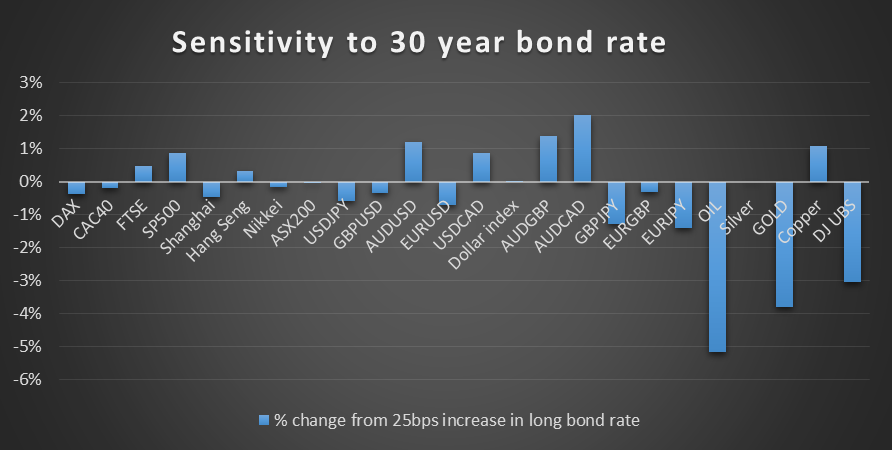
We can investigate the sensitivity of variables of interest to movements in the bond rate using the multiple regression model referred to above. The graph below shows the percentage movement in fair value of variables given an (arbitrarily chosen) further 25bps increase in the 30-year bond rate:

Clearly there is a complex interplay of factors that would be associated with a higher US long term bond rate – including a stronger US economy and therefore US corporate earnings and US demand for imports, flows of money to higher yielding US securities, downward pressure on valuations. Our modeling points to where the sensitive areas are based on historical correlations.
This Friday’s April nonfarm payrolls read could be an important indicator of the state of the US economy and therefore the direction of bond rates. Based on bond rate movements around nonfarm payroll readings as far back as 2007, a surprise on the upside has added 5bps to the rate on average vs 1bp for disappointments. The consensus is that 225k was added in April.
