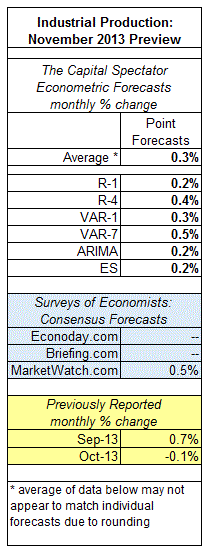
Monday’s November report on US industrial production (scheduled for release on Dec. 16) is projected to post a 0.3% rise vs. the previous month, based on The Capital Spectator's average econometric forecast. The expected gain marks a modest rebound after October’s 0.1% decline. Meanwhile, the Capital Spectator’s average projection for November is a bit lower than a consensus forecast via a survey of economists.
Here's how the numbers stack up, followed by brief definitions of the methodologies behind The Capital Spectator's projections:
R-1: A linear regression model using the ISM Manufacturing Index to predict industrial production. The historical relationship between the variables is applied to the more recently updated ISM data to project industrial production. The computations are run in R.
R-4: A linear regression model using four variables to project industrial production: US private payrolls, an index of weekly hours worked for production/nonsupervisory employees in private industries, the ISM Manufacturing Index, and the stock market (S&P 500). The historical relationships between the variables are applied to the more recently updated data to project industrial production. The computations are run in R.
VAR-1: A vector autoregression model using the ISM Manufacturing Index to predict industrial production. VAR analyzes the interdependent relationships of the variables through history. The forecasts are run in R using the "vars" package.
VAR-7: A vector autoregression model using seven variables to project industrial production: US private payrolls, an index of weekly hours worked for production/nonsupervisory employees in private industries, the ISM Manufacturing Index, the stock market (S&P 500), real personal income less current transfer receipts, real personal consumption expenditures, and oil prices. VAR analyzes the interdependent relationships through history. The forecasts are run in R using the "vars" package.
ARIMA: An autoregressive integrated moving average model that analyzes the historical record of industrial production in R via the "forecast" package to project future values of the data set.
ES: An exponential smoothing model that analyzes the historical record of industrial production in R via the "forecast" package to project future values of the data set.
- English (UK)
- English (India)
- English (Canada)
- English (Australia)
- English (South Africa)
- English (Philippines)
- English (Nigeria)
- Deutsch
- Español (España)
- Español (México)
- Français
- Italiano
- Nederlands
- Português (Portugal)
- Polski
- Português (Brasil)
- Русский
- Türkçe
- العربية
- Ελληνικά
- Svenska
- Suomi
- עברית
- 日本語
- 한국어
- 简体中文
- 繁體中文
- Bahasa Indonesia
- Bahasa Melayu
- ไทย
- Tiếng Việt
- हिंदी
US Industrial Production: November 2013 Preview
Latest comments
Loading next article…
Install Our App
Risk Disclosure: Trading in financial instruments and/or cryptocurrencies involves high risks including the risk of losing some, or all, of your investment amount, and may not be suitable for all investors. Prices of cryptocurrencies are extremely volatile and may be affected by external factors such as financial, regulatory or political events. Trading on margin increases the financial risks.
Before deciding to trade in financial instrument or cryptocurrencies you should be fully informed of the risks and costs associated with trading the financial markets, carefully consider your investment objectives, level of experience, and risk appetite, and seek professional advice where needed.
Fusion Media would like to remind you that the data contained in this website is not necessarily real-time nor accurate. The data and prices on the website are not necessarily provided by any market or exchange, but may be provided by market makers, and so prices may not be accurate and may differ from the actual price at any given market, meaning prices are indicative and not appropriate for trading purposes. Fusion Media and any provider of the data contained in this website will not accept liability for any loss or damage as a result of your trading, or your reliance on the information contained within this website.
It is prohibited to use, store, reproduce, display, modify, transmit or distribute the data contained in this website without the explicit prior written permission of Fusion Media and/or the data provider. All intellectual property rights are reserved by the providers and/or the exchange providing the data contained in this website.
Fusion Media may be compensated by the advertisers that appear on the website, based on your interaction with the advertisements or advertisers.
© 2007-2025 - Fusion Media Limited. All Rights Reserved.
