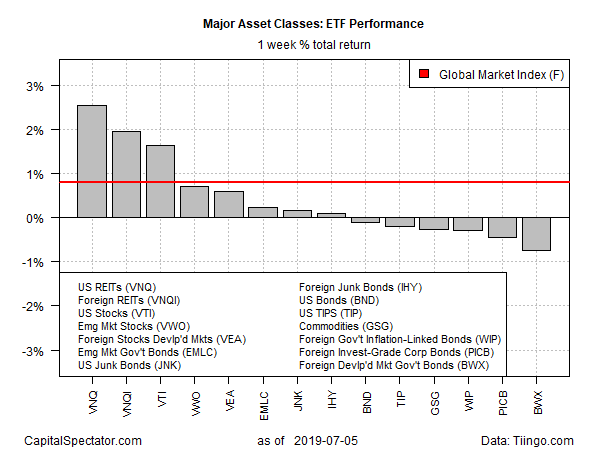
Property shares in the US and offshore markets posted the biggest gains for the major asset classes in the first week of trading for the third quarter, based on a set of exchange-traded funds.
US real estate investment trusts (REITs) led the way via Vanguard Real Estate (NYSE:VNQ), which popped 2.5% for the trading week ended July 5. Foreign real estate shares were in close pursuit: Vanguard Global ex-U.S. Real Estate (NASDAQ:VNQI) gained 2.0%, rising to its highest weekly close since early 2018.
Foreign bonds posted the biggest losses last week. The steepest setback was in SPDR Bloomberg Barclays International Treasury Bond (NYSE:BWX), which shed 0.7%. The decline marks the first weekly loss for the ETF in three weeks.
Foreign corporates suffered the second deepest loss last week. Invesco International Corporate Bond (NYSE:PICB) shed 0.5%.
Meanwhile, an ETF-based version of Global Market Index (GMI.F) continued to rise last week. This unmanaged benchmark, which holds all the major asset classes (except cash) in market-value weights, added 0.8% — the fifth consecutive weekly gain for GMI.

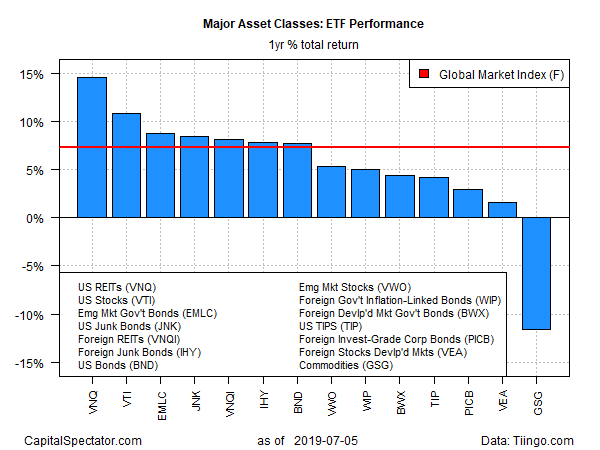
For the one-year trend (252 trading days), US real estate investment trusts are still leading the major asset classes, although the margin of leadership has narrowed lately. Vanguard Real Estate (VNQ) is up a solid 14.6% on a total return basis through last week’s close.
In second place: US equities. Vanguard Total Stock Market (NYSE:VTI) posted a 10.8% total return at last week’s close.
Commodities continue to suffer the biggest — the only — loss for the trailing one-year window for the major asset classes. GSG is down 11.6% over the past 12 months.
For markets overall, the one-year trend is still comfortably positive. The weighted benchmark for global assets – GMI.F – is currently posting a healthy 7.2% total return for the year through July 5.

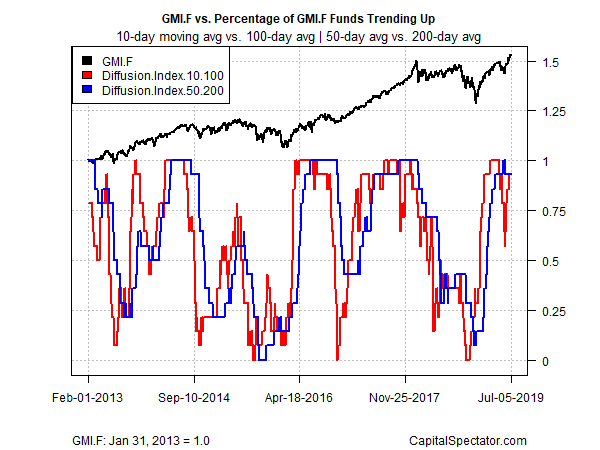
Price momentum for the major asset classes continues to skew positive overall, based on the ETFs listed above. The analysis reflects two sets of moving averages. The first compares the 10-day moving average with its 100-day counterpart — a proxy for short-term trending behavior (red line in chart below). A second set of moving averages (50 and 200 days) offers an intermediate measure of the trend (blue line). On this basis, as of last week’s close, a majority of funds reflects a bullish trend.

