It’s not even close. As early starts for calendar years go on a global basis, the U.S. stock market’s roaring debut in 2020 so far has left the rest of the world in the dust, based on a set of exchange-traded funds.
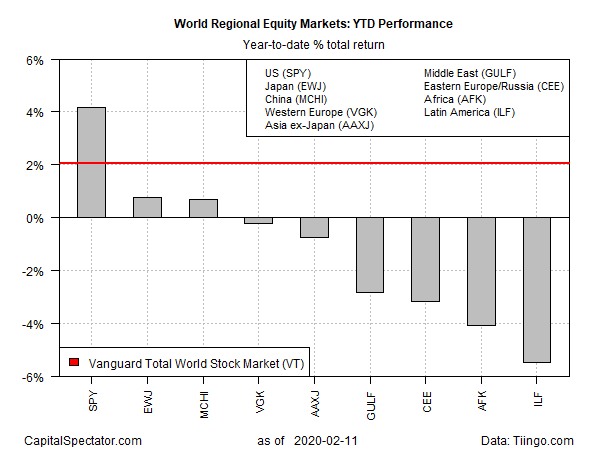
The U.S. proxy, SPDR S&P 500 (SPY (NYSE:SPY)), is up 4.2% year to date through Tuesday’s close (Feb. 11). Although the fund stumbled in late-January, largely due to worries over the spreading coronavirus, sentiment has since rebounded and SPY rose to a record high yesterday.
U.S. shares continue to be an outlier relative to the rest of the world for 2020 performances. The global benchmark, Vanguard Total World Stock (NYSE:VT), is ahead by a relatively modest 2.1%.

“[U.S.] market sentiment is being significantly boosted as most investors and analysts now expect the impact of the deadly flu on economies to be short-lived and contained within [the first quarter],” says Pierre Veyret, an analyst at ActivTrades.
“An air of relief has permeated global markets following a sustained decline in the rate of new coronavirus cases, diminishing the risk premium,” advises Nema Ramkhelawan-Bhana, an economist at Firstrand Bank Ltd. in Johannesburg, South Africa. “The absolute impact on economic growth is yet to be quantified, but markets appear more confident that its effects will be limited to the first quarter. The efforts of Chinese policy makers will prop up growth.”
For now, however, the crowd is making an outsized bullish bet on US stocks this year. The second-best year-to-date performer — iShares MSCI Japan (NYSE:EWJ) – is well behind America’s juggernaut rally. EWJ is up fractionally with an 0.8% gain so far in 2020.

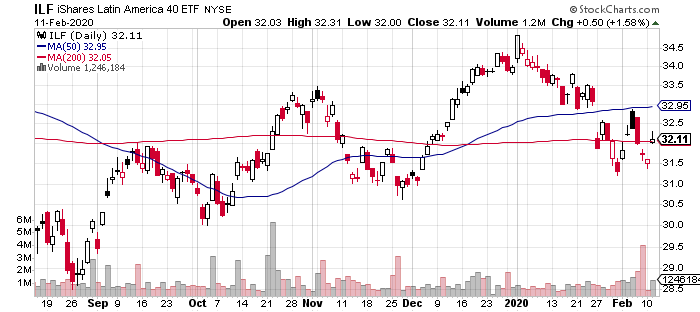
Note, too, that most of the field is currently underwater this year. The deepest year-to-date loss: iShares Latin America 40 (NYSE:ILF), which has shed 5.5%.

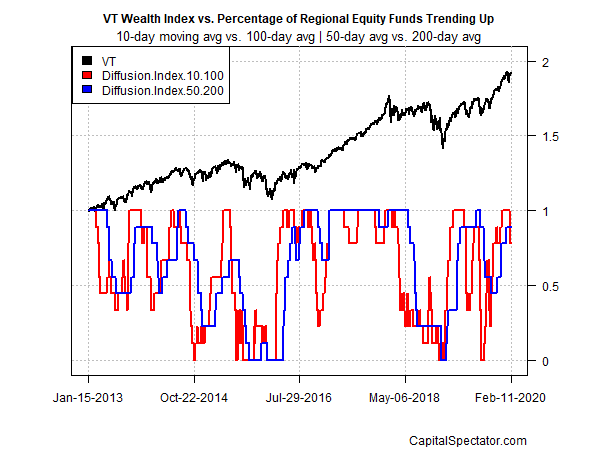
Despite the weakness in several corners of the global equity market, positive momentum overall still has the upper hand for the funds listed above. The analysis is based on two sets of moving averages, which point to a broad-based upside bias overall for global shares. The first measure compares the 10-day average with its 100-day counterpart — a proxy for short-term trending behavior (red line in chart below). A second set of moving averages (50 and 200 days) represent an intermediate measure of the trend (blue line). Using data through yesterday’s close indicates that most ETFs on the regional list continue to post a positive momentum profile.
