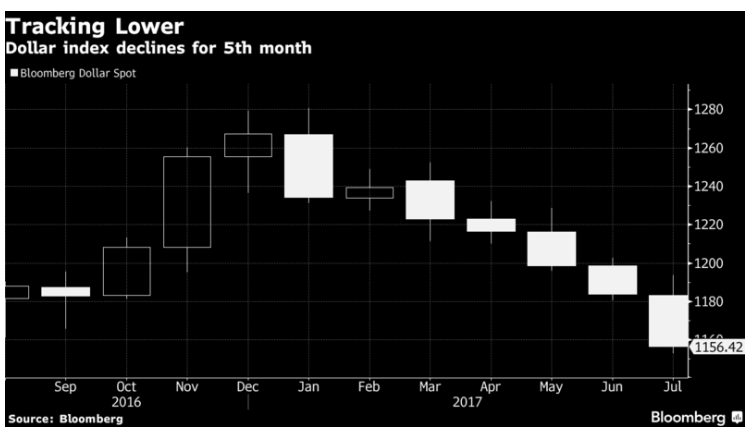
The USD Index has dipped over 9% this year. The weakness in US Dollar has been broad-based and consistent against all major currencies. The Dollar Index closed fifth straight month in losses , something which hasn’t happened since 2011. The USD weakness started with the Euro early this year then continues to widen to other currencies.

There are several factors which contribute to this weakness.
- The market gets disappointed with the ability of Trump’s administration to deliver the pro-growth agenda. The failure of Trump’s administration to repeal Obamacare and the elimination of border-adjusted tax have reduced prospective revenue sources for Trump’s fiscal plan. These legislative gridlock made tax-reform an ever-distant prospect.
- Meanwhile, Fed’s policy normalization is no longer helping the US Dollar as other central banks also start to normalize their monetary policy. BOC (Bank of Canada) last month started to raise the interest rate by 25 bps. ECB (European Central Bank) is also expected to announce gradual winding down of its quantitative easing (QE) program on Sept 7 meeting as the economic growth in the Euro zone has improved.
- The Fed indicated last month that rates are close to a “netural” level and not in need of a significant move higher. The Fed also said they are more concerned about weaker inflation. The Fed’s focus therefore will shift from rate hike to shrinking the QE balance sheet (Quantitative tightening).
- The debt ceiling issue coming in September. Congress has already left for August recess and when they return, they only have weeks to raise the debt ceiling by September 29 or the US could run out of money to pay its bills. A deal will raise the US borrowing limit to continue routine payment, such as Social Security benefit
- Escalating geopolitical tension with Russia and North Korea.
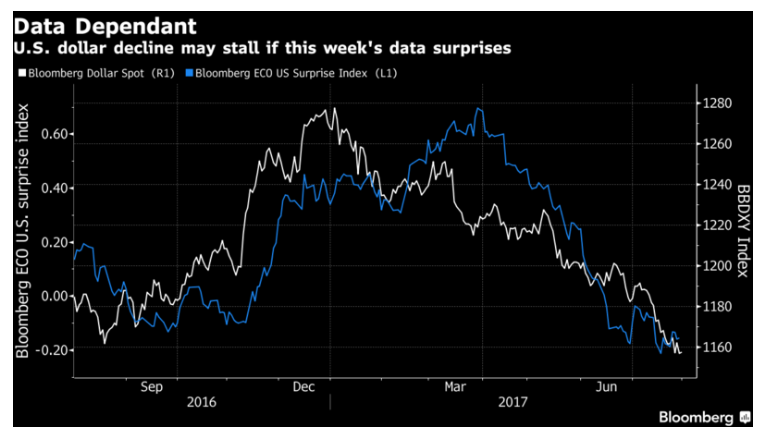
The above factors could remain in play for the remainder of 2017 which suggests USD should remain soft. However, in the short term, correction is possible as USD selloff has reached the extreme area. This week is likely an important week for the dollar as traders wait for the nonfarm payrolls number. The USD decline may stall if there’s a data surprise. In addition, technically USD Index is near the 200 Weekly Moving Average at 92.3 which may provide temporary support

US Dollar Long Term Outlook
Below we will take a look at two USD pairs: USD/CAD and USD/NOK to forecast the path of USD for the next few months:
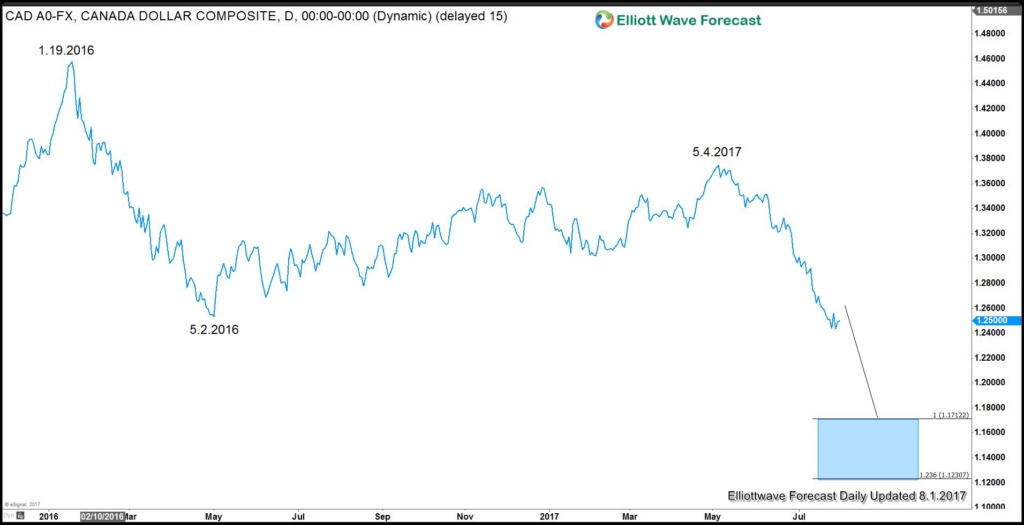
Daily USD/CAD Bearish Sequence
USD/CAD Daily Chart is showing a bearish sequence from 1.19.2016 peak as the pair broke below 5.2.2016 low. Although bounces could be expected in the near term, pair has scope to extend lower towards 1.123 – 1.171 area in the next few months before larger support can be seen. We expect USD/CAD to remain heavy despite the selloff in the past 2 months.
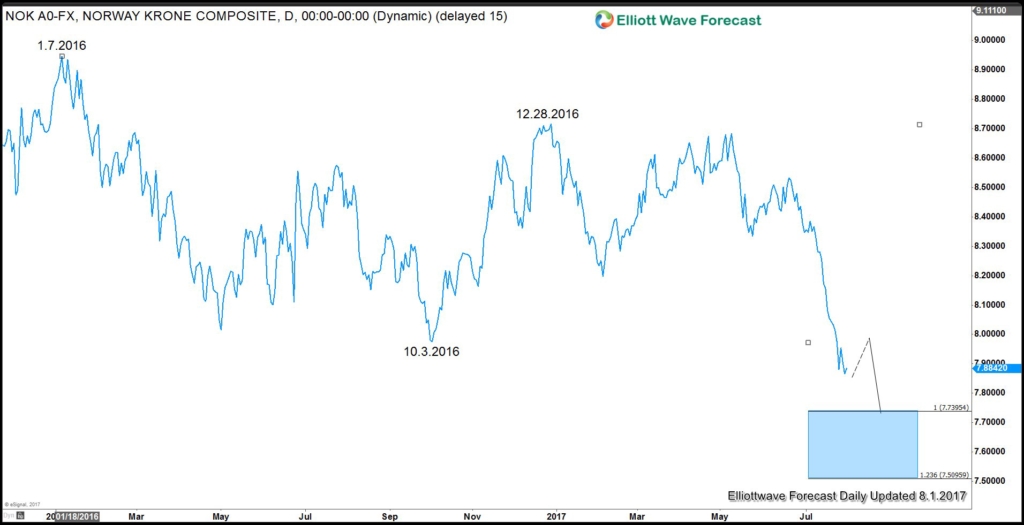
Daily USD/NOK bearish sequence
Similar to USD/CAD, Daily chart of USD/NOK also shows bearish sequence from 1.7.2016 high as pair has broken below 10.3.2016. Pair has scope to extend lower to 7.5096 – 7.395 area to end cycle from 1.7.2016 peak before larger support is seen. The pair is also telling us that USD could remain heavy for the next few months, although short term bounces could be seen along the way.
As the market is dynamic, traders need to keep up with the most up-to-date analysis of their favorite instrument. Successful traders need to have a good trading system and also strict risk management with rules that define entry, stop loss, and take profit levels with high accuracy to allow traders to get into a risk free position in your trade as quickly as possible.
