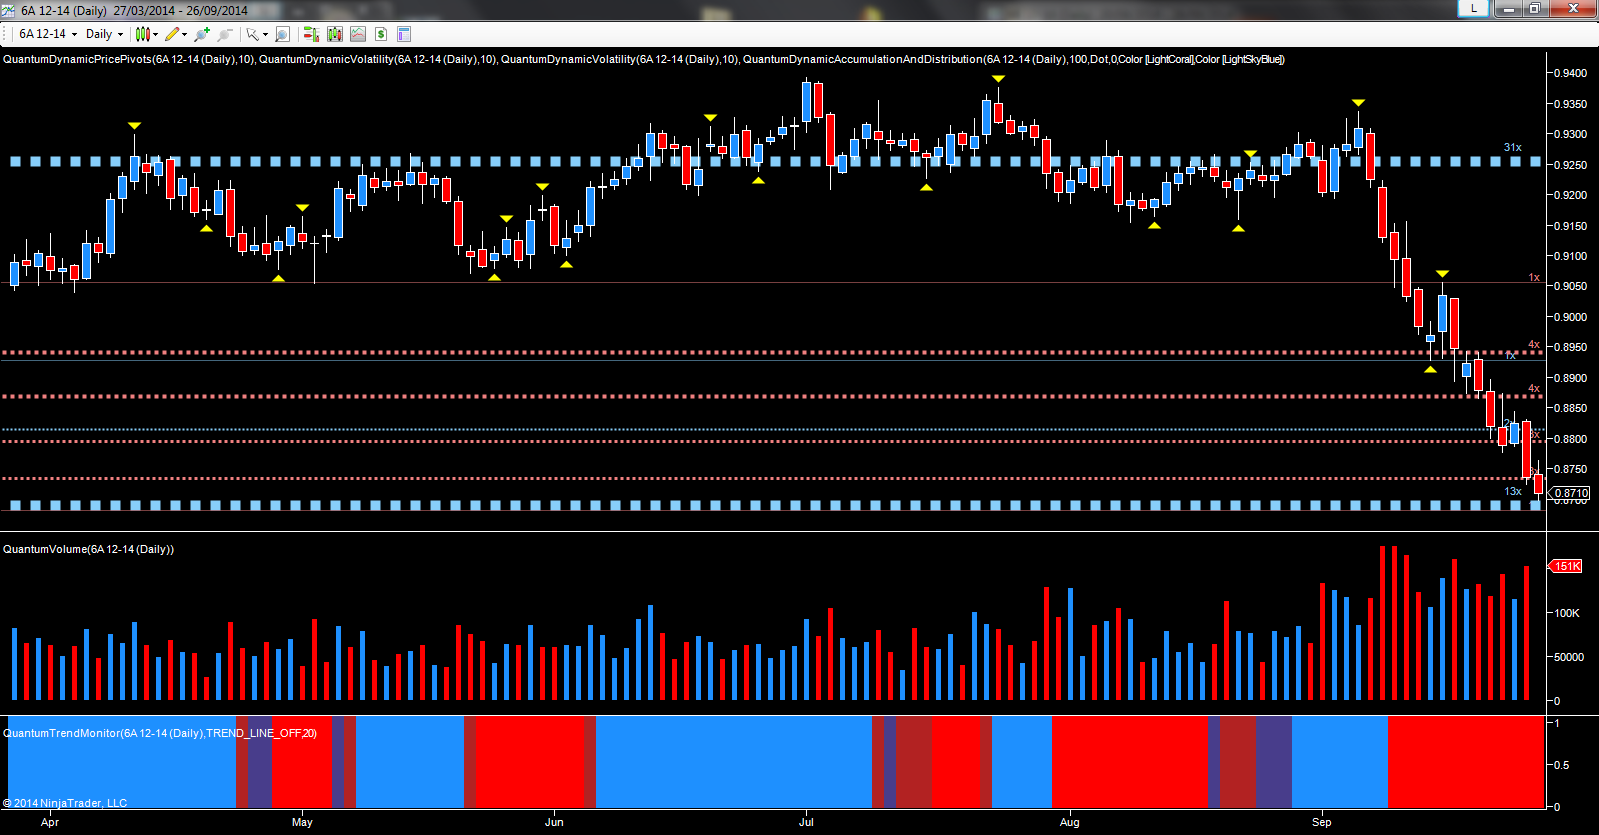
It’s been another torrid week for many of the majors, as sustained US dollar strength continues to drive the currency markets, coupled with assistance from the central banks. For the Aussie dollar, it was another week of bearish sentiment with the pair lurching lower once more, with momentum building, as the pair breached potential minor support in the 0.8820 area, which hinted at a pause, before being firmly broken on Thursday with a wide spread down candle on high volume. The pair closed on Friday with yet another down candle, and testing a major level of potential support in the 0.8700 region. If this is breached, as expected, then 0.8470 seems to be the next logical target as the price waterfall continues.

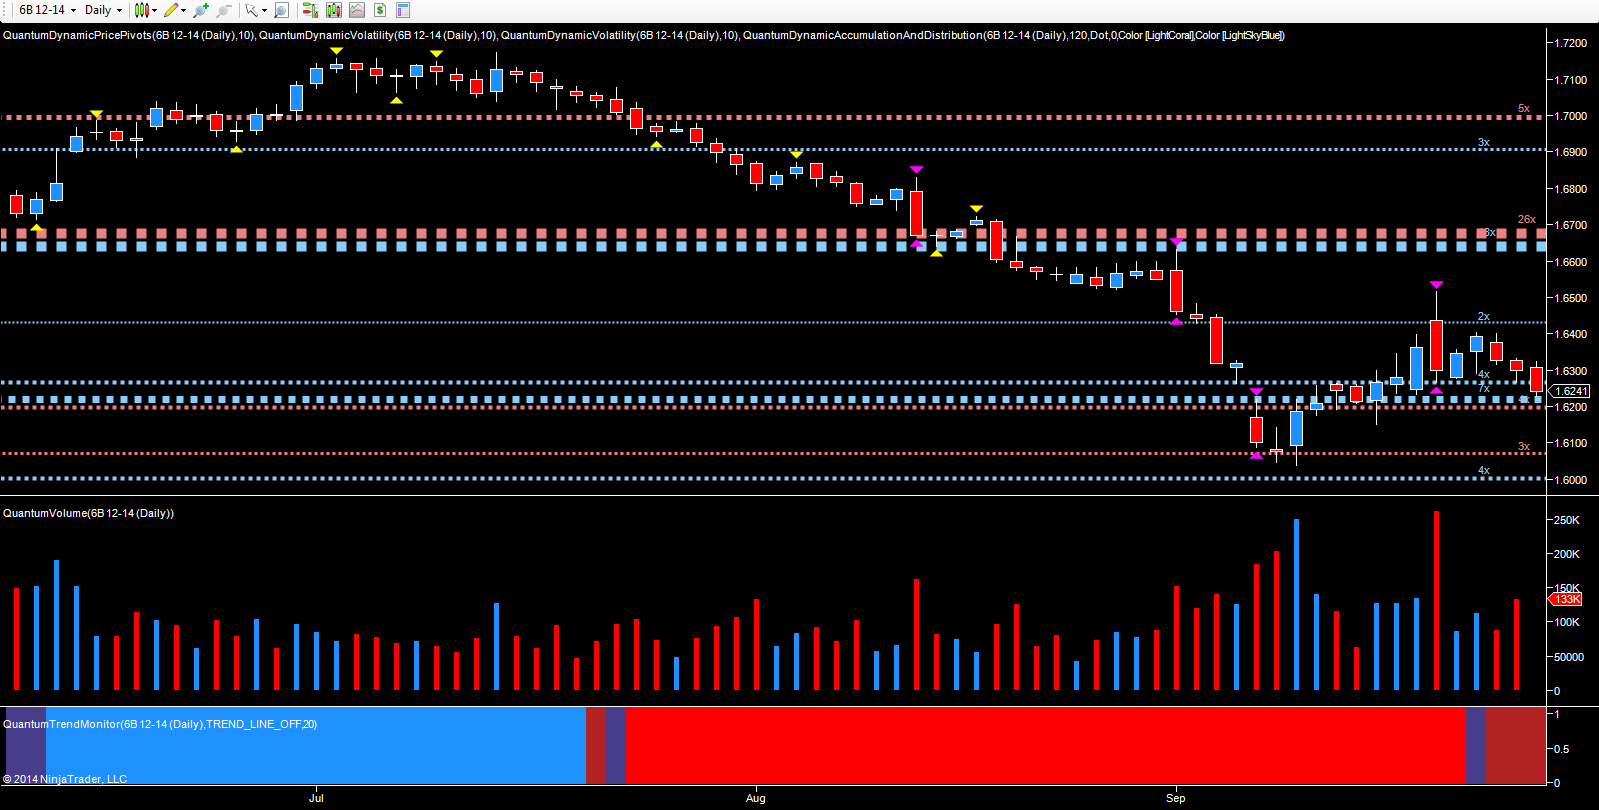
For the British pound, it’s been a case of ‘after the Lord Mayor’s show’, with the dust now settling on the Scottish referendum, and clearly signalled on the daily chart for the December futures contract. The day itself ended with a wide spread down candle, with wicks to both top and bottom and on ultra high volume, having opened gapped up, before falling. This was a classic trap up move, beloved of the market makers and big operators, with many speculative traders thinking this was an easy money trade to the long side on a resounding no vote. Needless to say, the opposite occurred, with the day triggering the volatility indicator, with the price action of this week, then moving back to trade inside the spread of the candle. In other words, the price action of last Friday week has not been validated, suggesting further downside momentum to come. The contract closed yesterday at 1.6241, and testing the key level of support as denoted with the blue dotted line in the 1.6220 region. So far this month, this level has held, but if this is broken next week, then expect to see a further move lower for cable, and back to test the 1.6080 in the medium term.

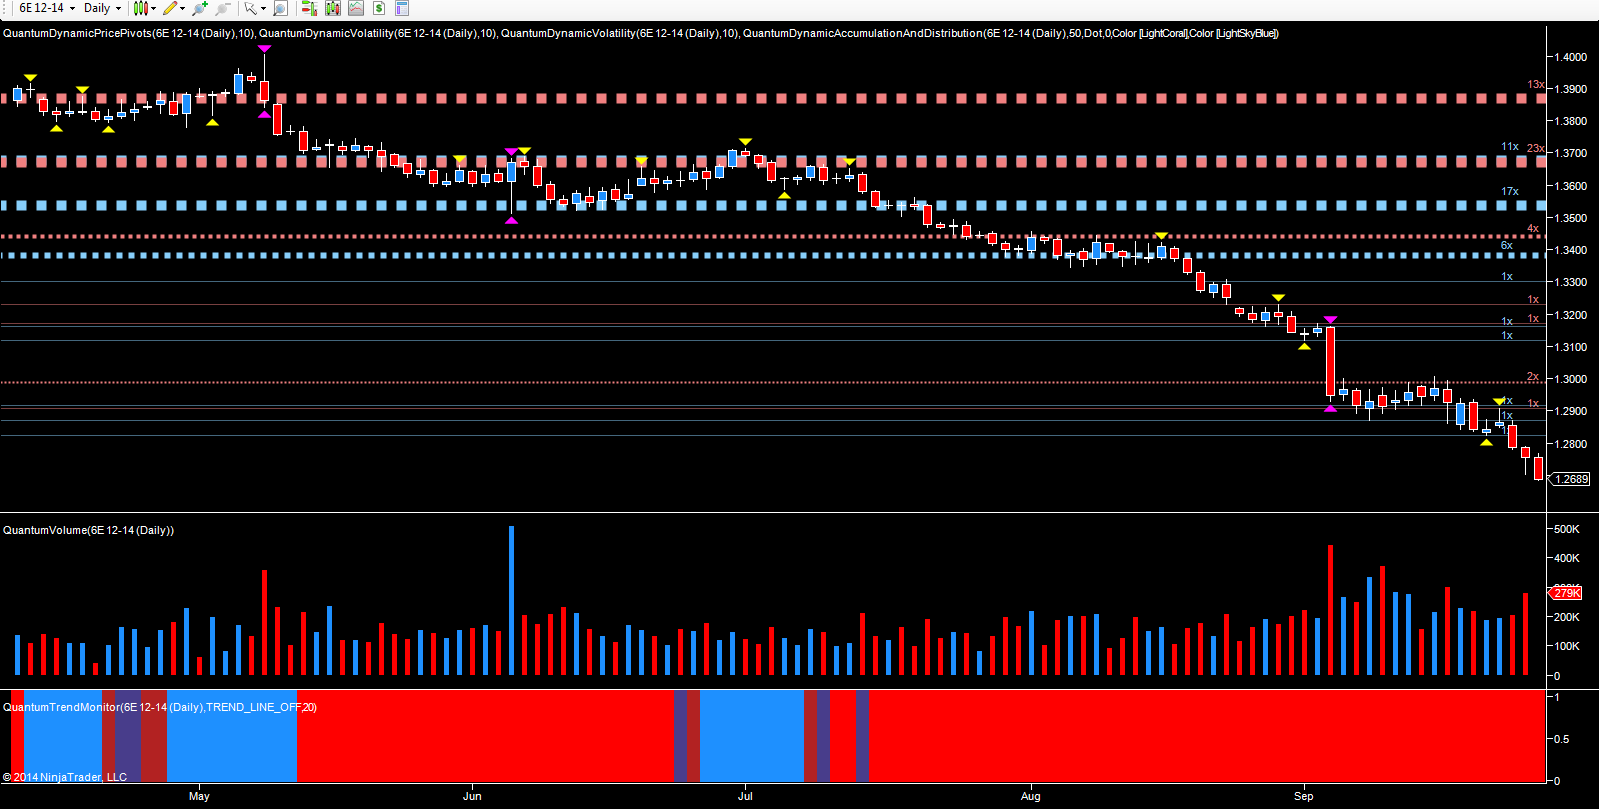
The EUR/USD continued to move lower, helped by the ECB, with the second half of the week, merely confirming the weak rally seen on Monday and Tuesday, as the pair attempted to rise on high volume with weak price action. Both candles closed with a narrow spread, and wicks to the top, and with the volumes clearly signalling selling, it was no surprise to see a resumption of the bearish sentiment on Wednesday, coupled with validation from the pivot high on this candle with the pair closing at 1.2689.

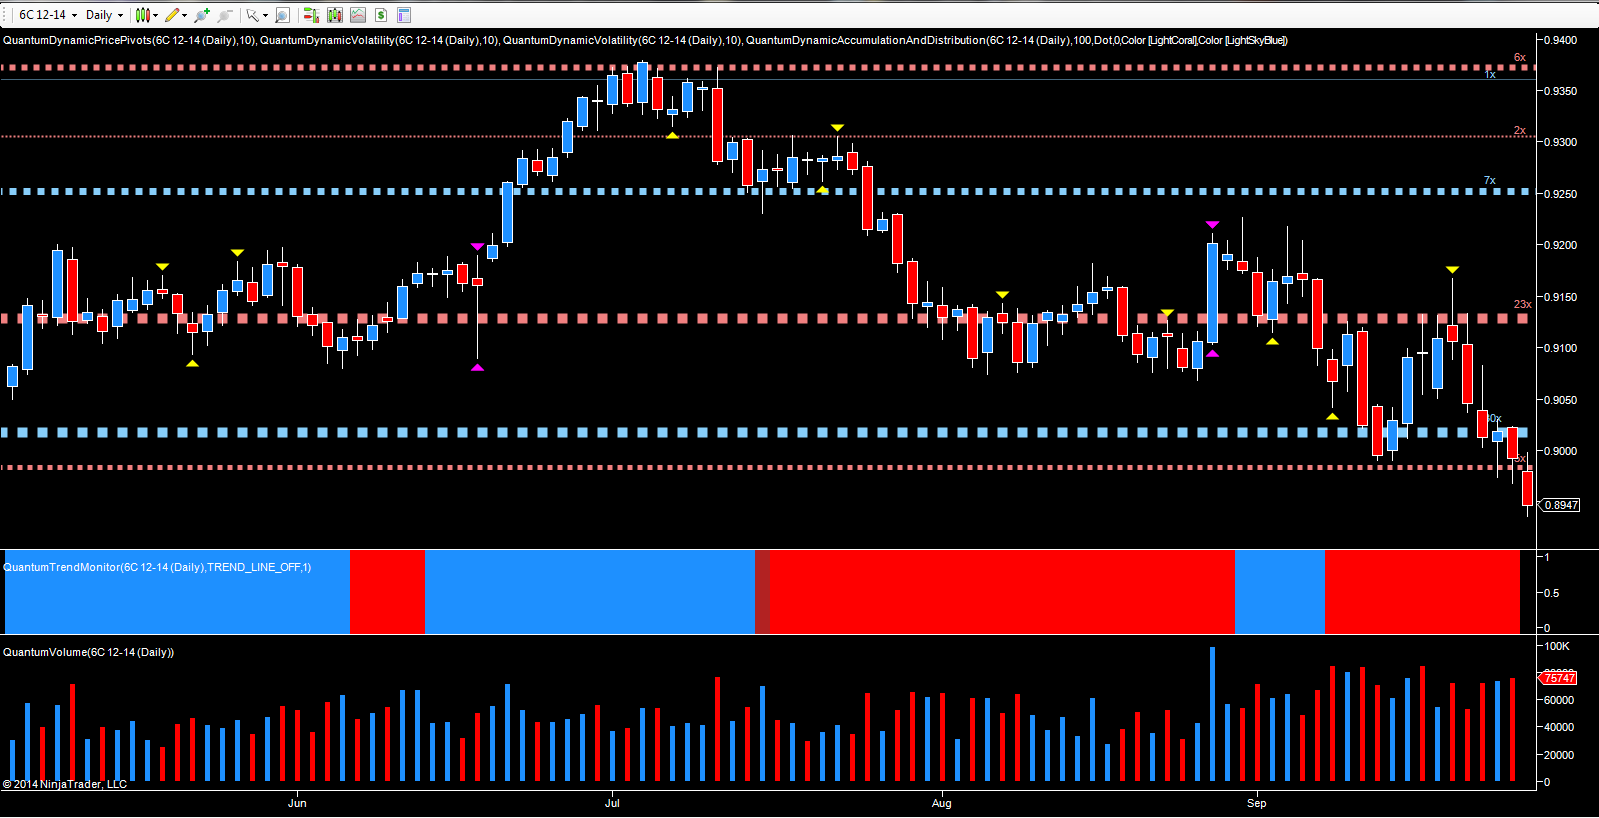
Finally to the CAD/USD and here again, the USD remains in control, with the pair narrowly avoiding a five day move lower, only reprieved on Wednesday with a minor bounce. The negative tone of the pair was really signaled on the candle from Friday last, which closed as a shooting star, following the minor rally off the 0.9020 region, which saw the pair test the 0.9170 area, before moving back below the solid resistance zone in the 0.9130 area. The price action of the last five days, then validated this weakness with rising volumes under the down candles, as the pair closed at 0.8947 on another wide spread down candle. Longer term the pair now look set to test the 0.8820 region, where further potential support awaits.
