Investing.com’s stocks of the week
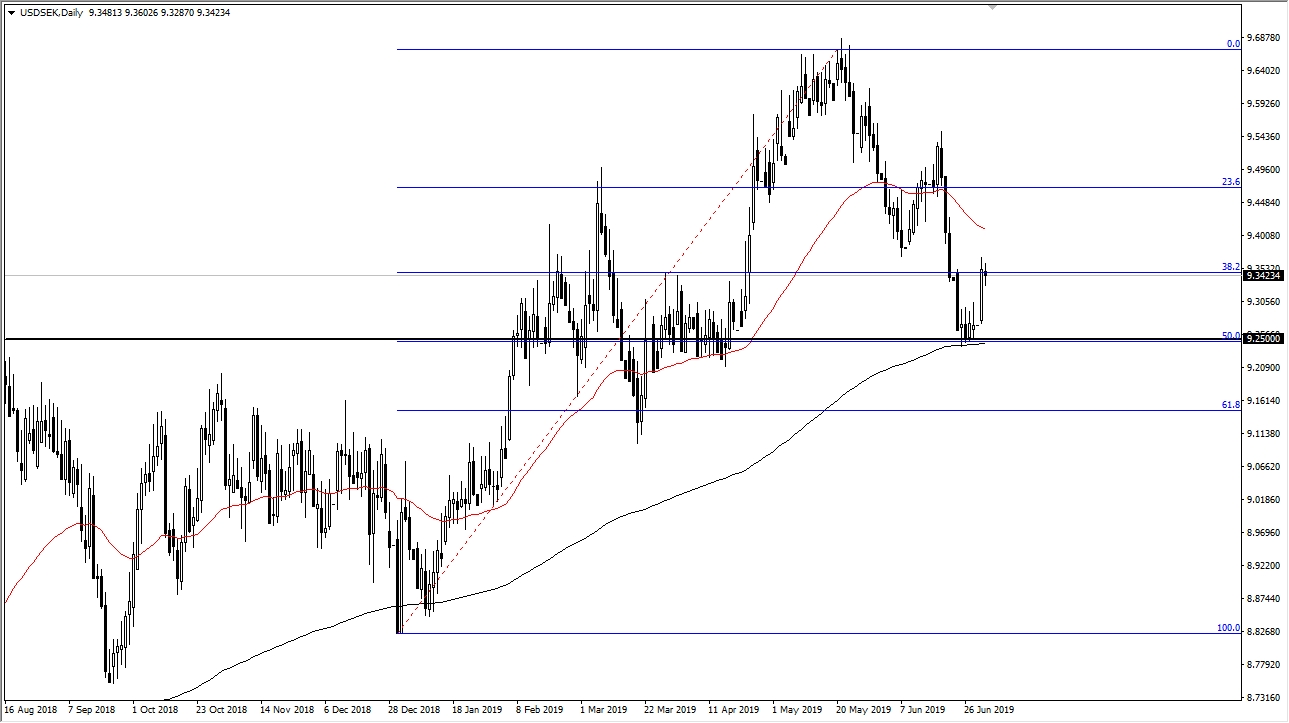
Over the last 24 hours we have seen a remarkable recovery in the USD/SEK pair, as we bounced from a major confluence of technical indicators. On the daily chart, we had been hovering just above the 200 day EMA for several sessions, but on Monday exploded to the upside. The candle stick was rather large, which of course is extraordinarily bullish, and making for an even more interesting set up is the fact that we had seen the 50% Fibonacci retracement level acted as support as well.
Looking at the daily chart we can also see that the Tuesday session is now starting to form a supportive looking candle as well, so if we can break above the highs during the trading session on Monday, then the market is likely to go looking towards the next major round figure, 9.5 SEK. To the downside, the obvious support is at the 9.25 SEK level, which featured the technical indications.
The question now is whether or not this is about US dollar strength or more of a risk off type of situation? The US dollar strength could be due to the stock markets in the United States, as they have shown a bit of resiliency in comparison to their European and Asian cousins. Ultimately, this looks like a nice long term set up that traders will be taken advantage of, with an obvious stop loss area. Beyond that, we could even see the market go above the 9.50 SEK level, but in the short term that would be your most obvious target. If we did break higher than that, the next target would be the 9.6 SEK level. If we were to break down below the 9.25 SEK handle, then it would open the door to the 9.15 SEK level below which also features the 61.8% Fibonacci retracement level.

