- The US dollar has rallied recently and is now consolidating gains.
- Geopolitical tensions and hawkish Fed comments are fueling the rise of the US dollar against major currencies like the euro and Japanese yen.
- Against the current backdrop, the US dollar index could break above 106 if bullish facros align.
- Invest like the big funds for less than $9 a month with our AI-powered ProPicks stock selection tool. Learn more here>>
The US dollar bulls have been buoyed by recent comments from Federal Reserve officials. Their hawkish stance, indicating that there is no rush to cut interest rates for now, is a key driver for the greenback.
This shift comes despite contrasting situations elsewhere. The European Central Bank is still contemplating a rate cut in June, and the interest rate gap between Japan and the U.S. remains significant.
So, the dollar continues to gain ground against major currencies. Further fueling this trend is the recent rise in geopolitical tensions, which – like gold – is pushing investors towards the safe haven of the U.S. dollar. 
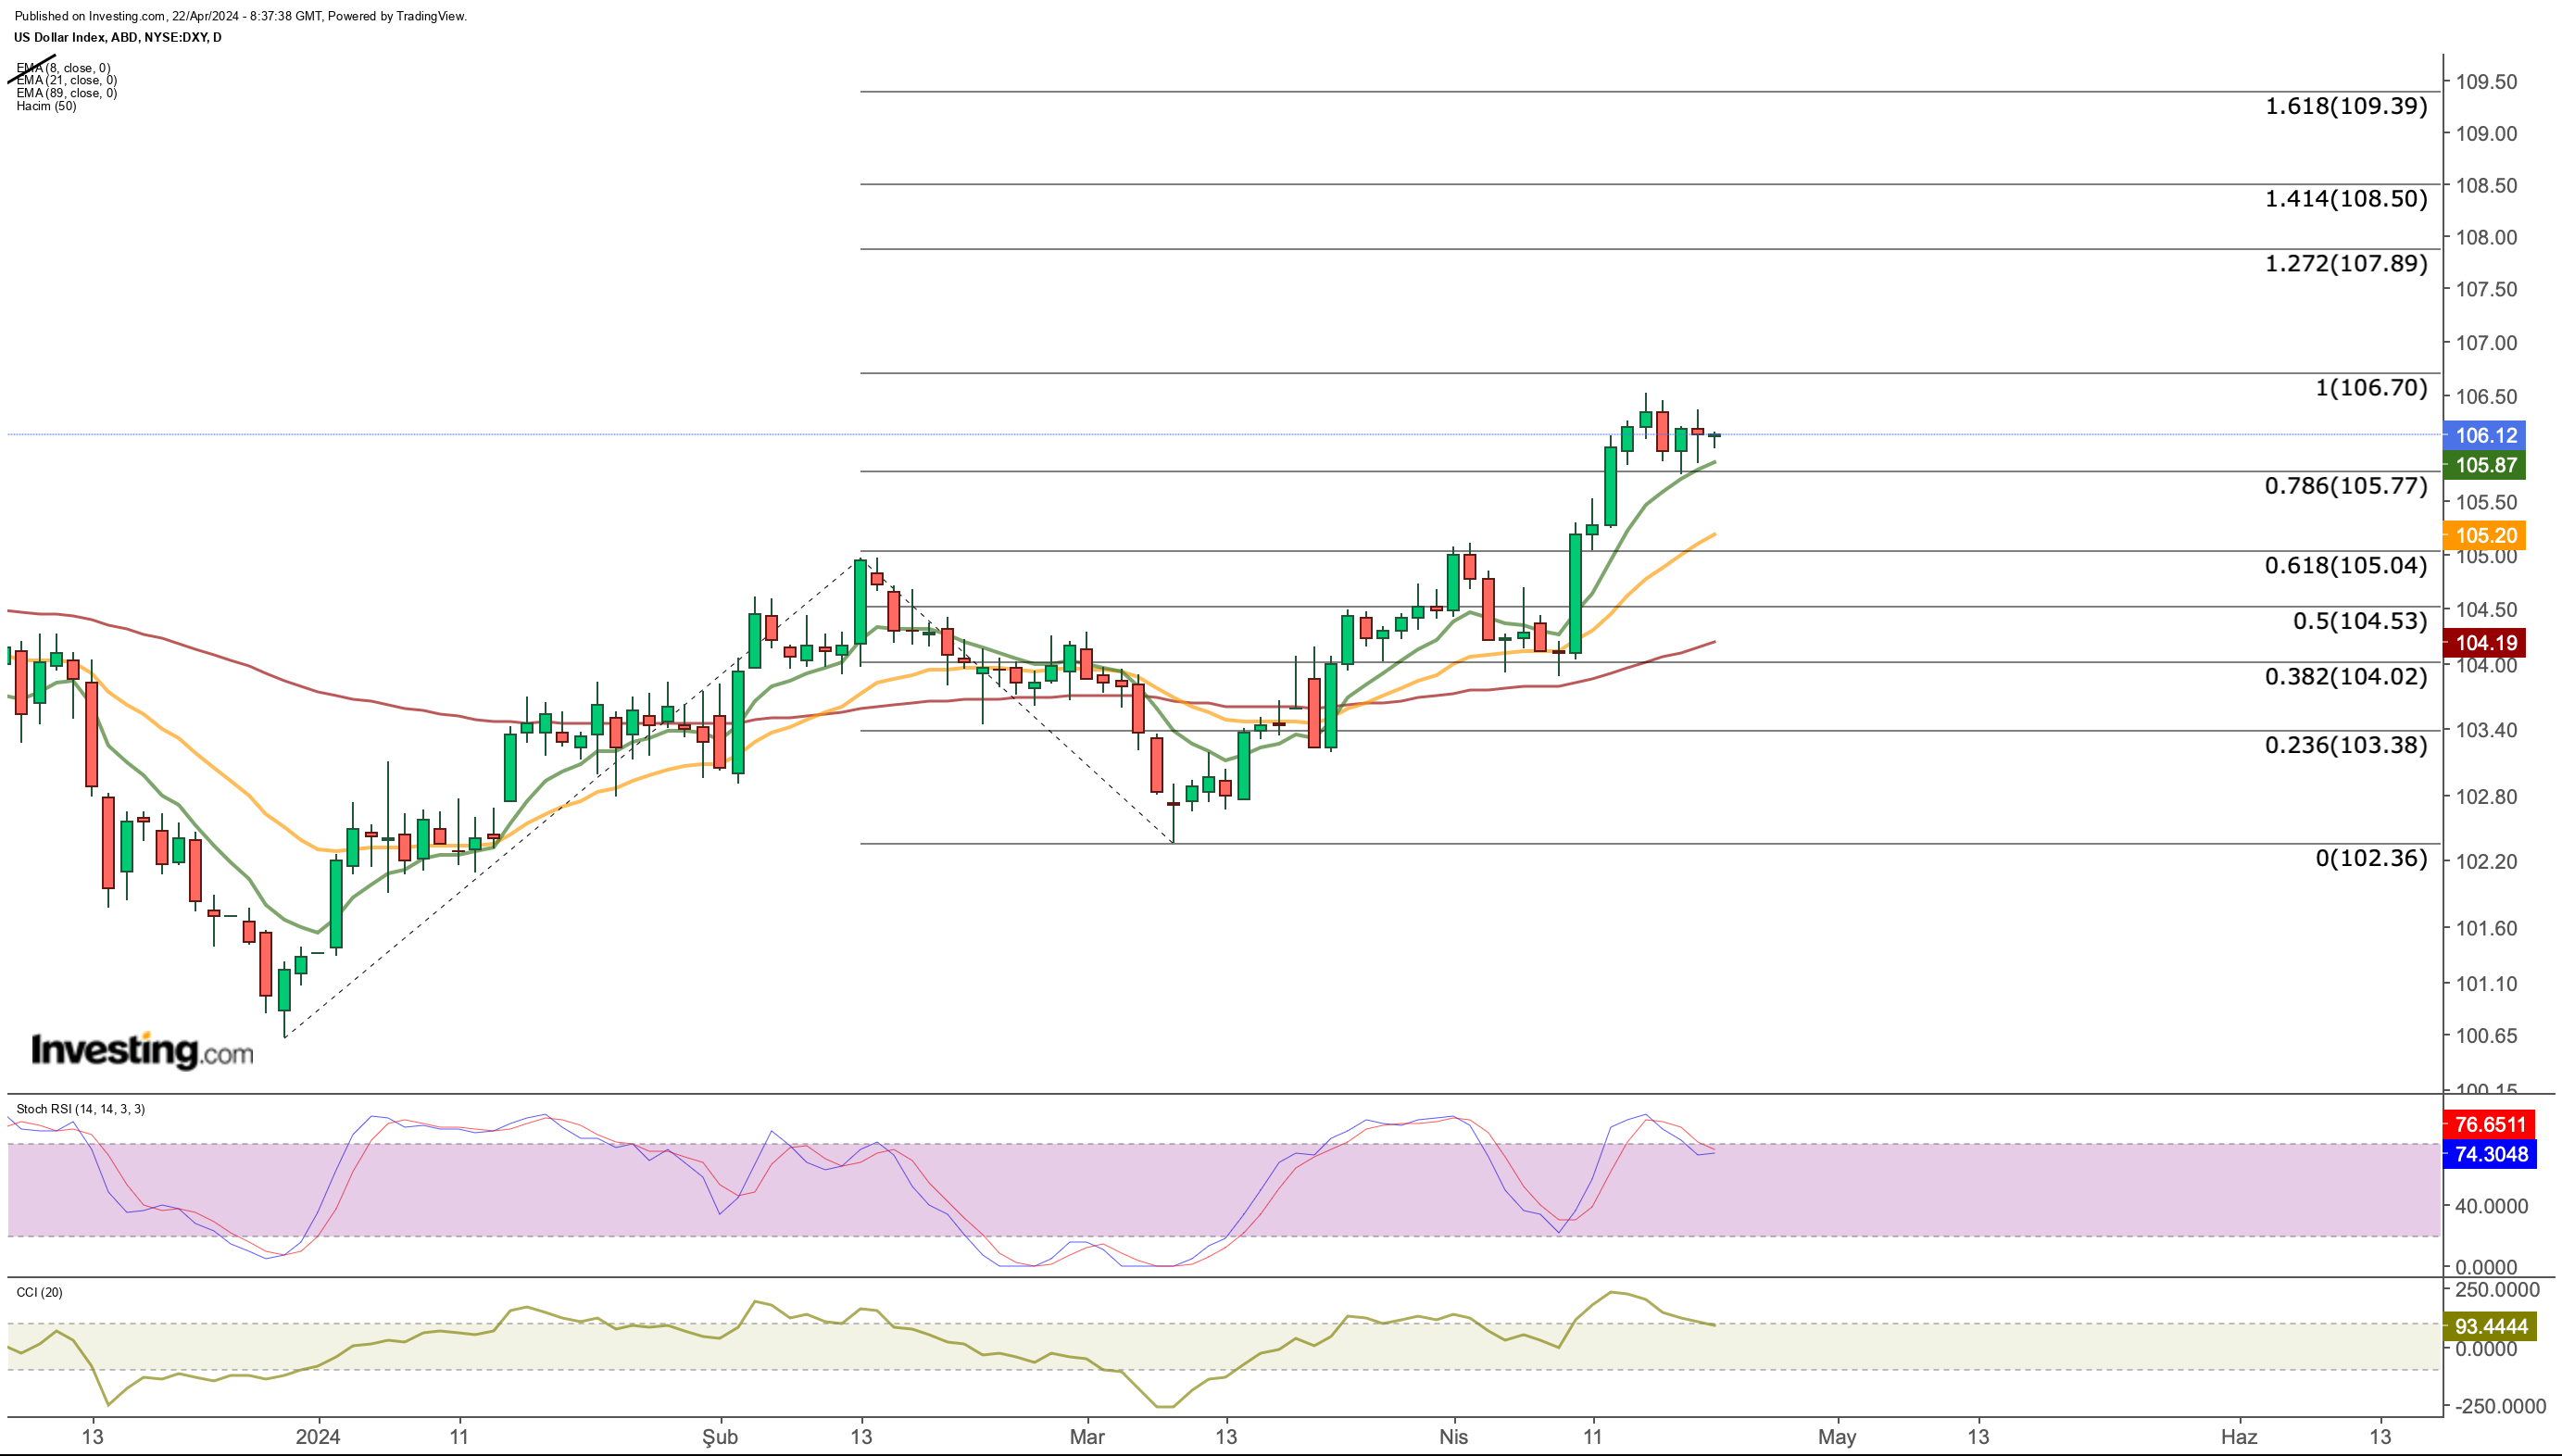
Strong U.S. economic data is also helping the dollar. Inflation rose more than expected again, pushing the DXY index (a measure of the dollar's strength) from 104 to 106. Since then, the DXY has held steady at around 105.7.
Earlier this year, 105.7 was a major hurdle for the DXY to overcome. But in March, the dollar reversed course and started climbing again.
Now, 105.7 acts as a floor for the DXY. To keep rising, the DXY needs to break decisively above 106.7, with strong trading volume, to target the 108-109 zone.
The main reasons behind the dollar's strength are expectations that the Fed will hold off on interest rate cuts, supported by recent positive economic data.
Here's the outlook: As long as the DXY stays above 105.7, it will likely keep testing resistance around 106. If the dollar weakens, it might find support at 105 again. And if it breaks out strongly, it could see a correction down to 104.
Euro Under Pressure
The dollar's strength worldwide keeps putting pressure on other currencies. Additionally, the euro is expected to weaken further against the dollar due to expectations that the European Central Bank (ECB) might start reducing interest rates in June.

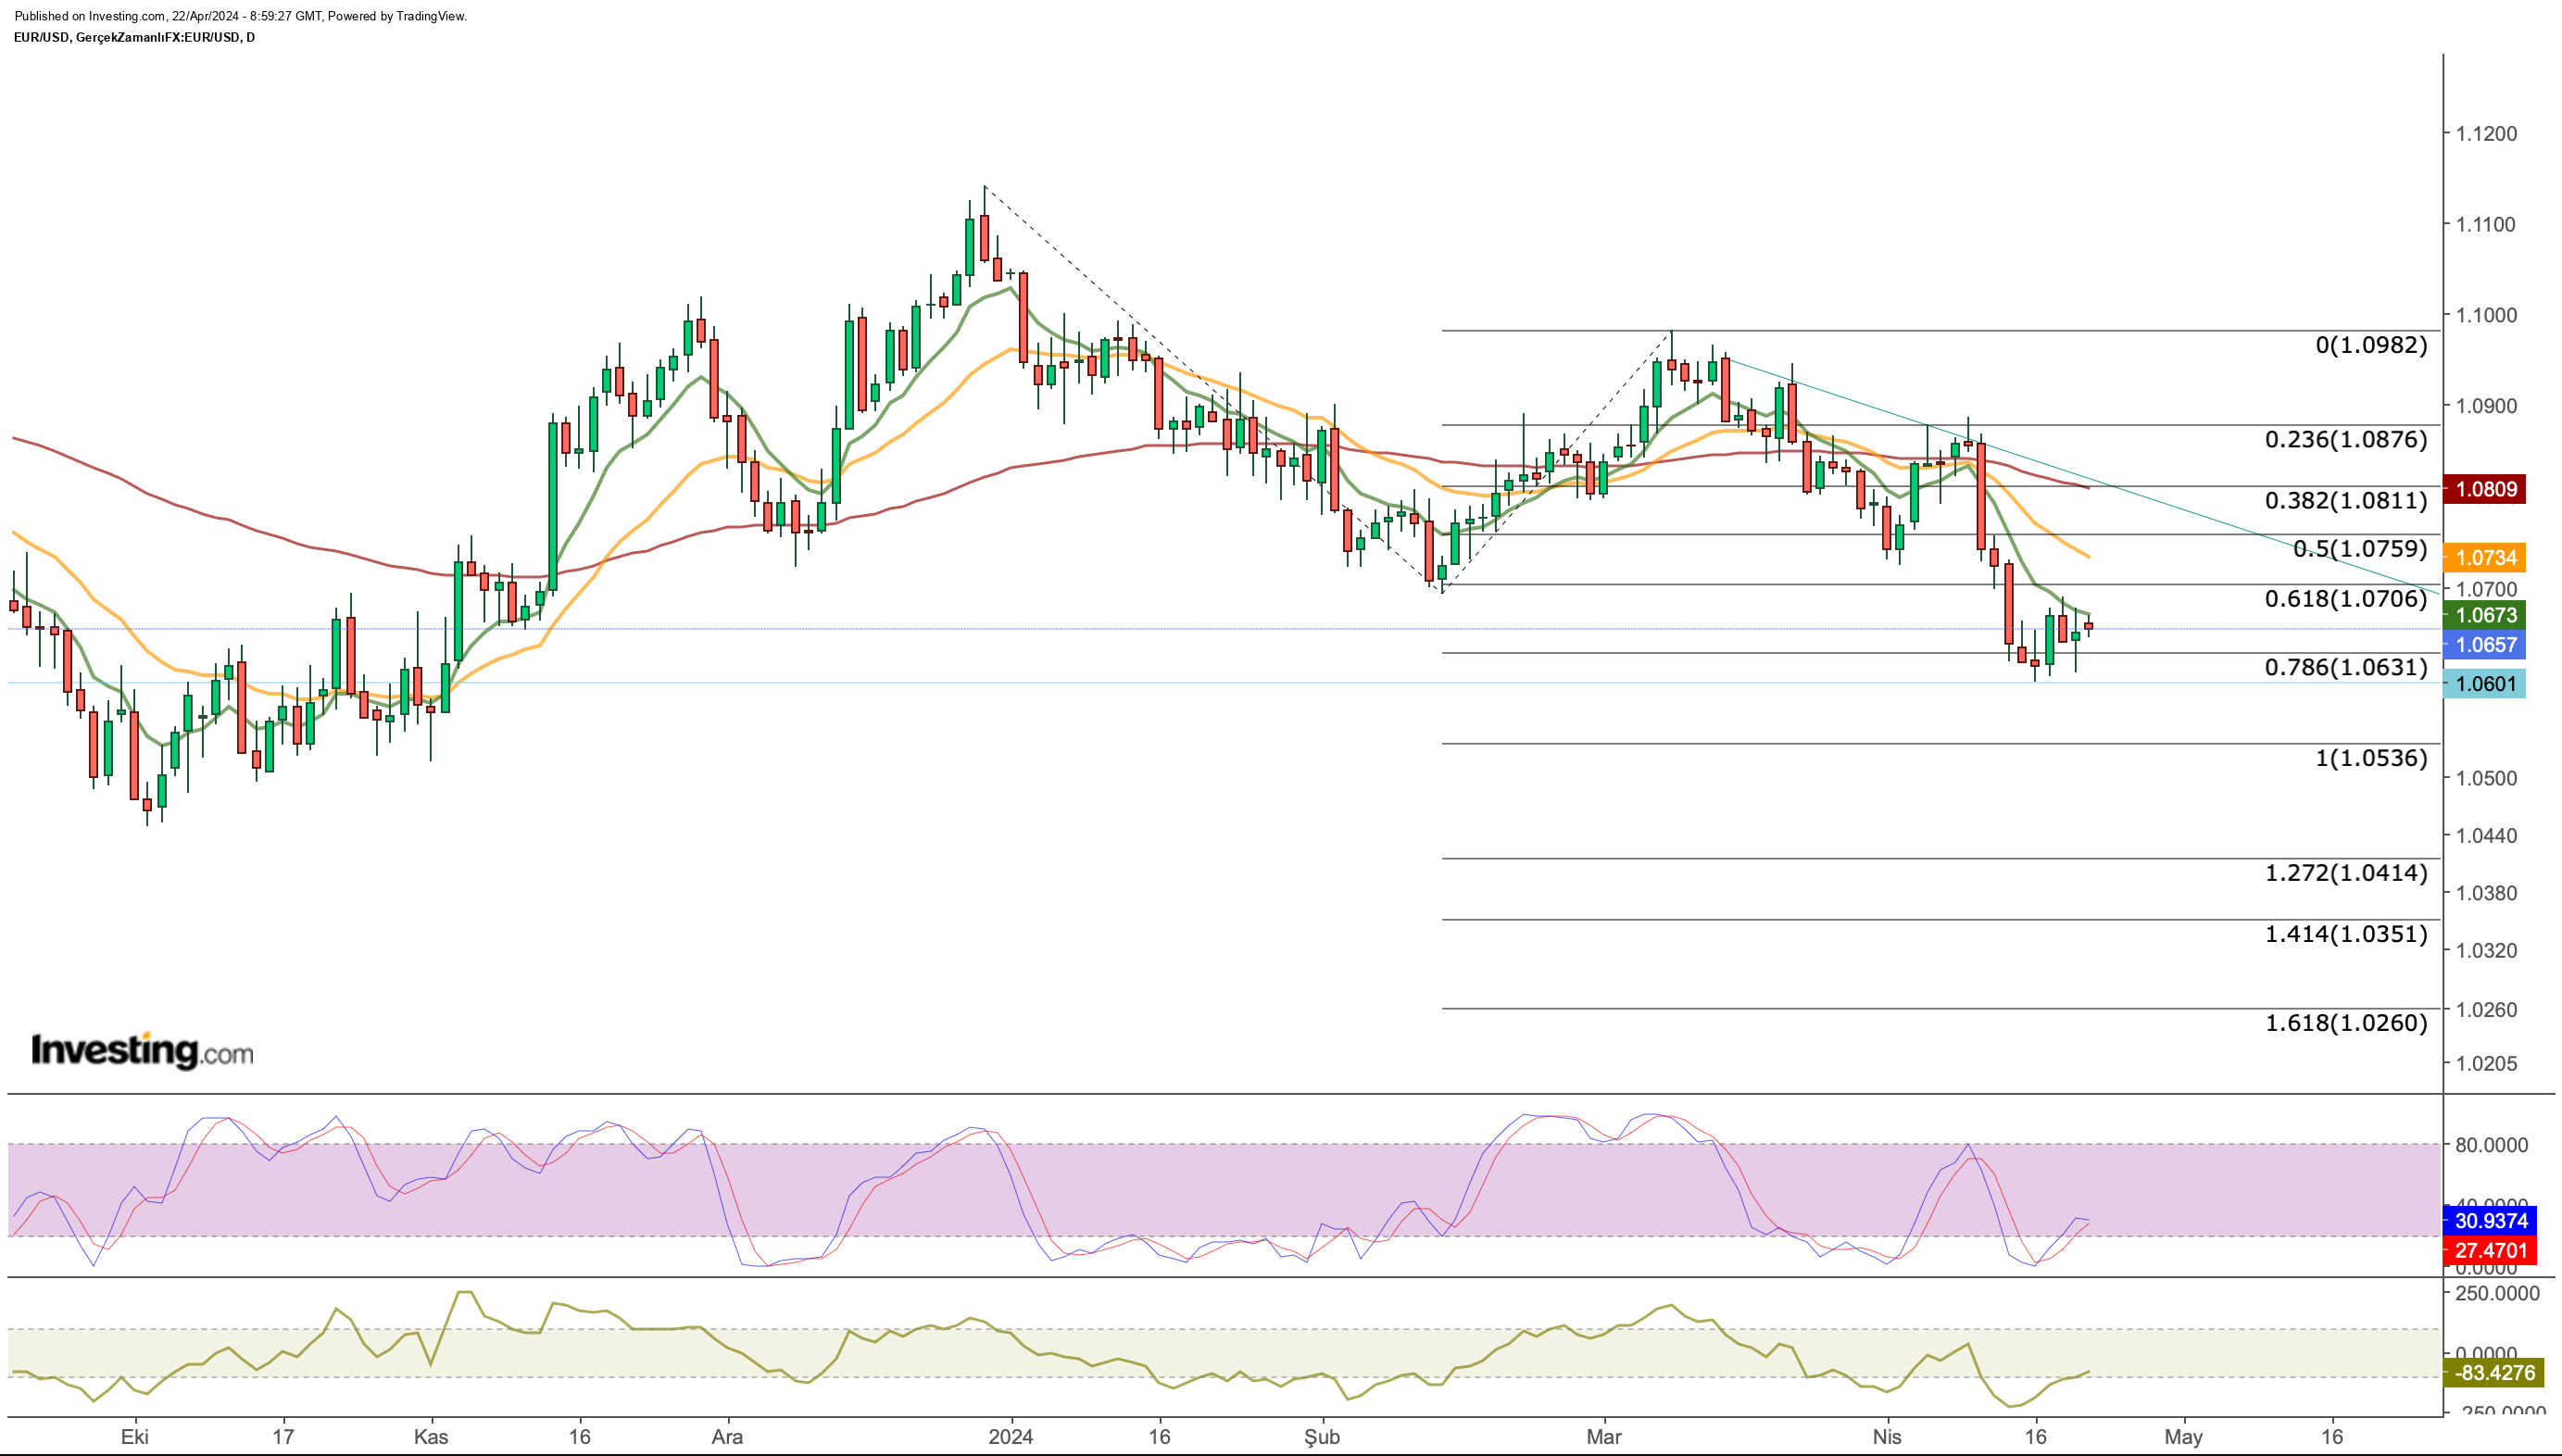
Last week, the euro dropped to 1.06, its lowest point in almost six months, after a significant decline the week before. Although the pace of decline slowed down last week, the currency faced resistance around the 1.067 mark.
Looking at the 2024 trend of EUR/USD based on Fibonacci levels, the 1.063 level corresponds to a strong support at Fib 0.786. This level has prompted buying reactions in the pair.
While 1.063 remains a crucial support level, the short-term moving average on the daily chart, currently at 1.067, could act as a dynamic resistance. According to Fibonacci values, the next resistance levels are at 1.07 and 1.076.
The Federal Reserve's cautious approach towards cutting rates, along with increasing suggestions that there might not be any cuts this year, contrasts sharply with the ECB's potential policy shift.
This divergence in policy stances is expected to further weaken the euro against the dollar, possibly pushing the EUR/USD exchange rate to the 1.0 level by the end of the year.
USD/JPY Approaches Critical Threshold
The Japanese yen dropped to a new low against the dollar in 34 years. This reflects the difference in interest rates between Japan and the US.
Looking at the daily chart for USD/JPY, it's clear the pair is at a crucial point. While it's highly unlikely the US will lower interest rates soon, this has caused the dollar to gain strength against the yen.
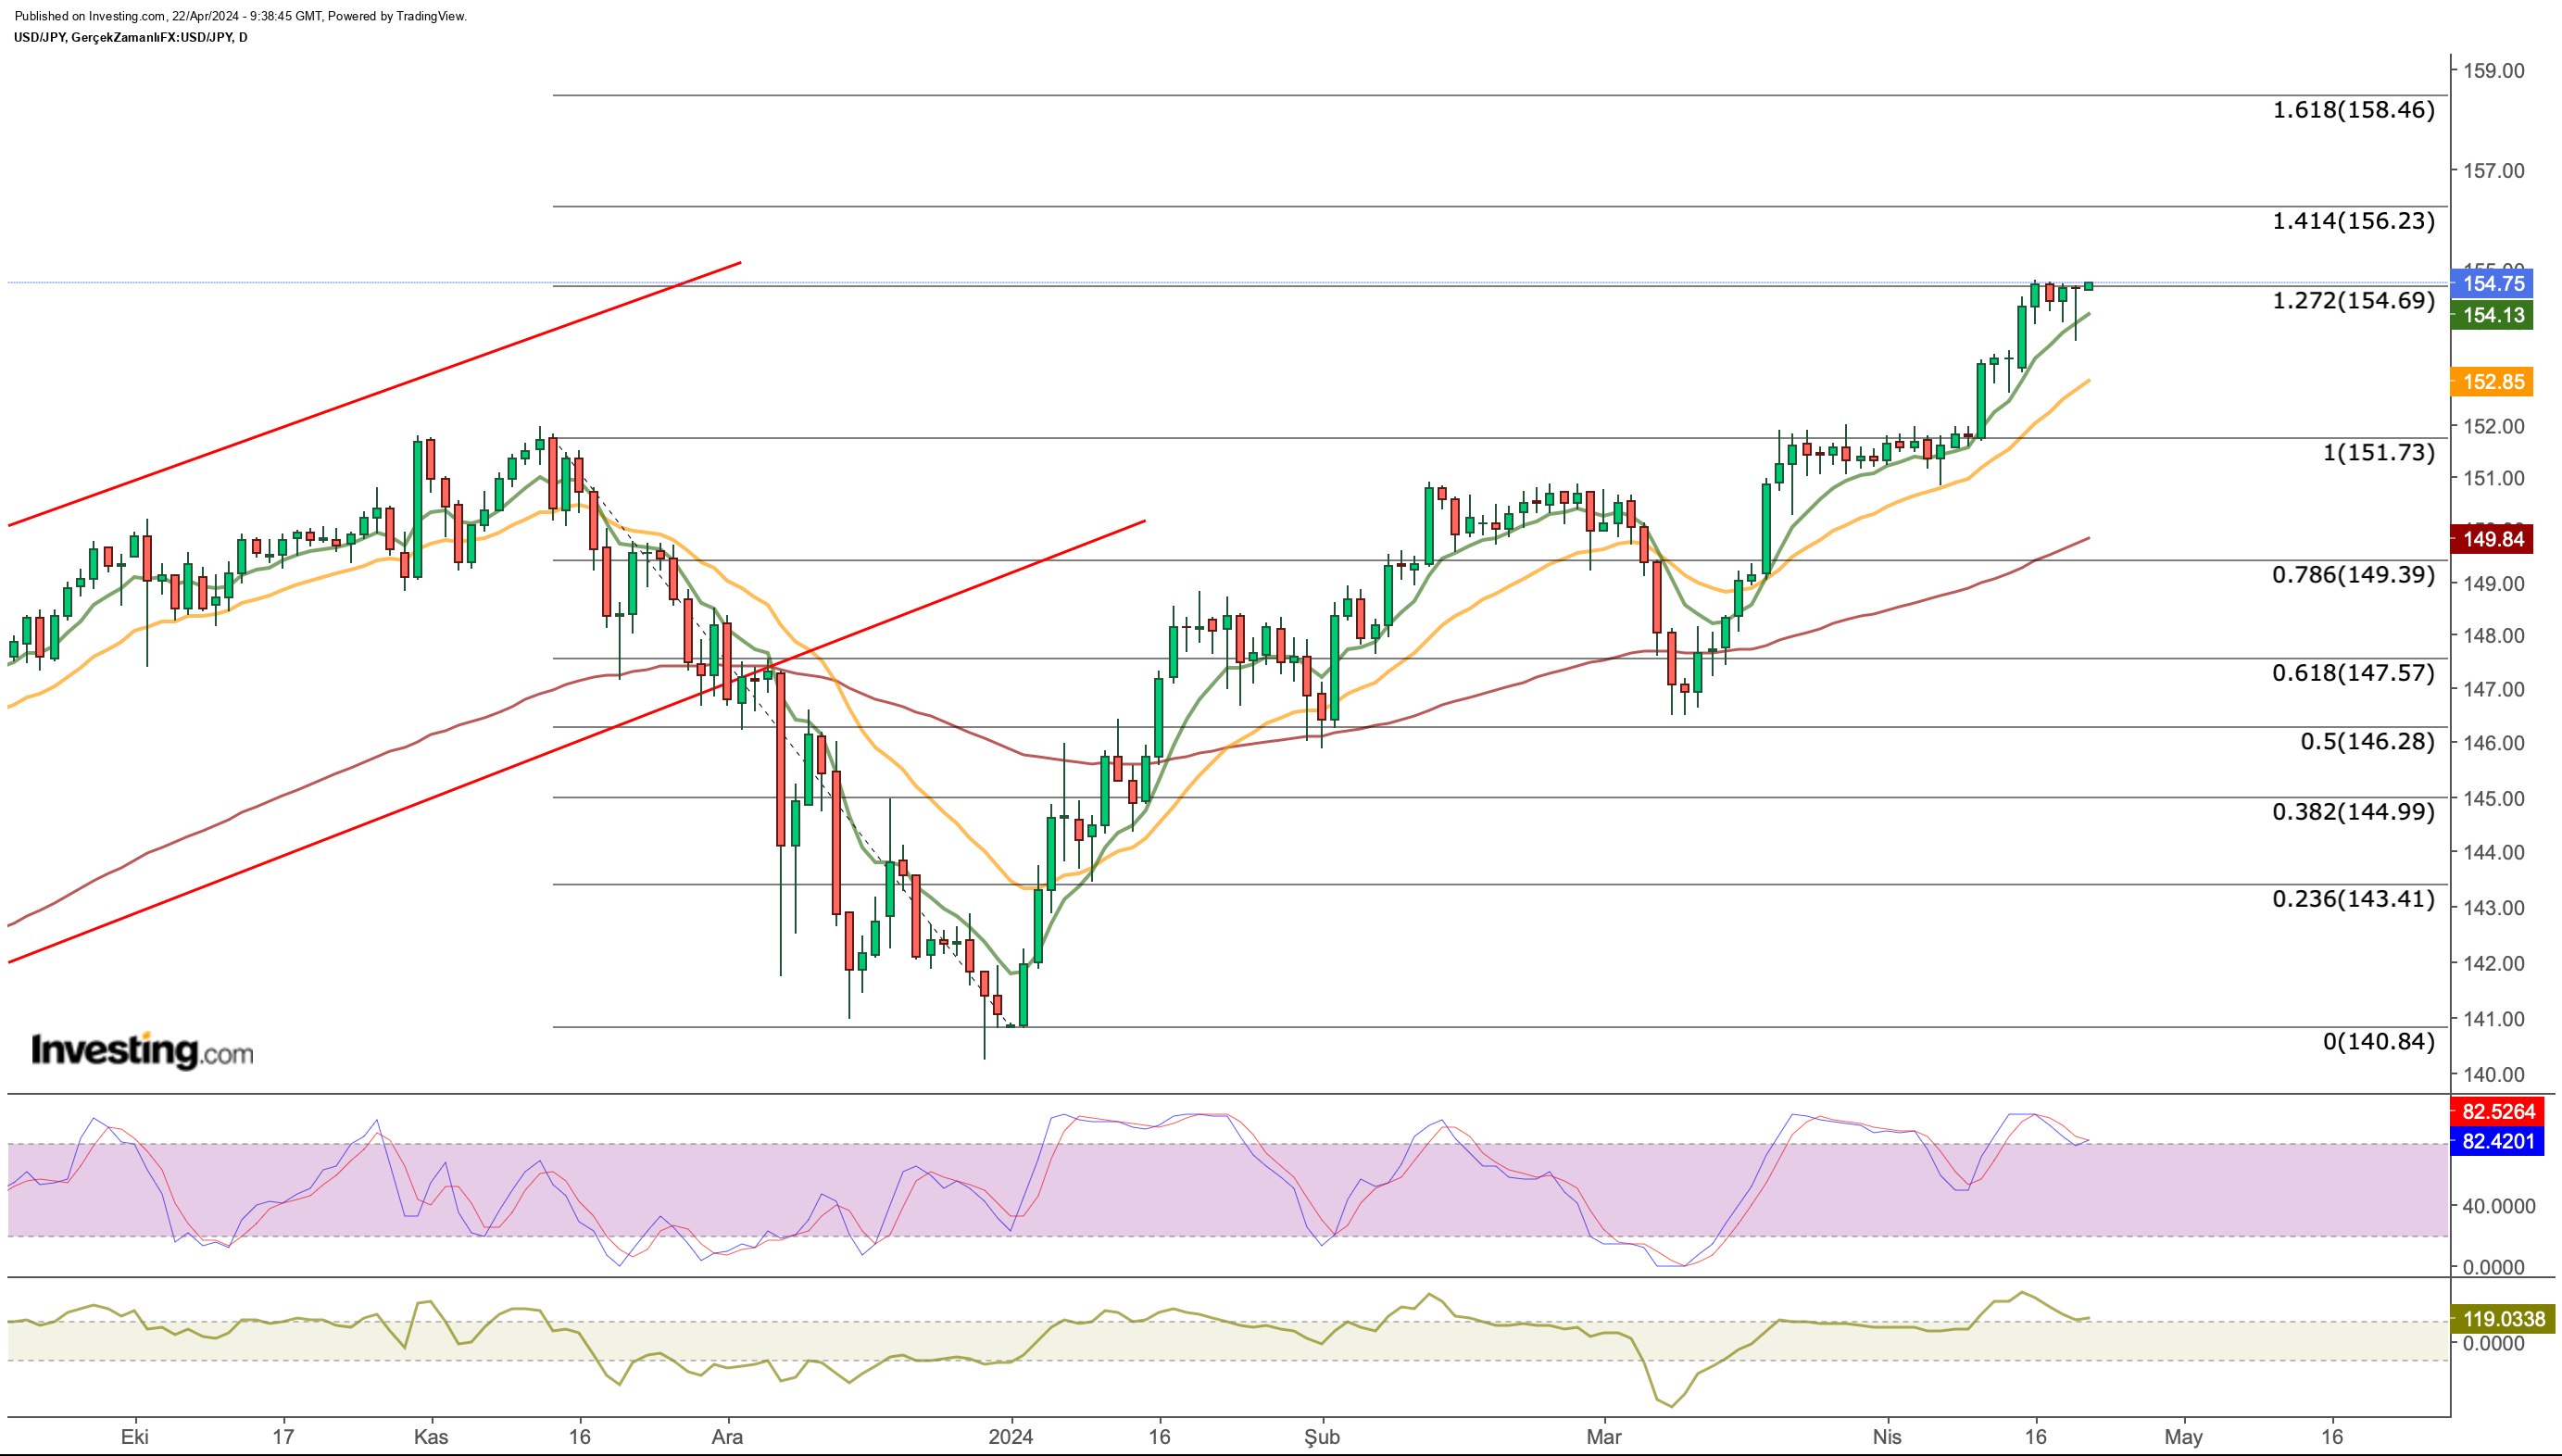
Talk of BoJ intervention has increased, pushing USD/JPY to an average level of 154.6 since last week.

Based on the retracement in late 2023, the resistance point aligns with Fib 1.272, which is the lower end of the Fibonacci expansion level.
Japan's interest rate decision is expected this week, and investors seem to be waiting to see what happens before making any moves.
The Governor of the Bank of Japan (BOJ), Kazuo Ueda, recently stated that the central bank will likely raise interest rates if the exchange rate keeps climbing.
A potential rate hike could briefly lower the exchange rate, possibly pulling it back to around 152 levels.
However, there's a chance of a trend reversal if the Japanese government steps in, as they've been trying to influence the market through their statements.
On the positive side, breaking through the resistance at 154 with daily closings could push USD/JPY towards 156.2 and then 158.46.
Gold Pulls Back
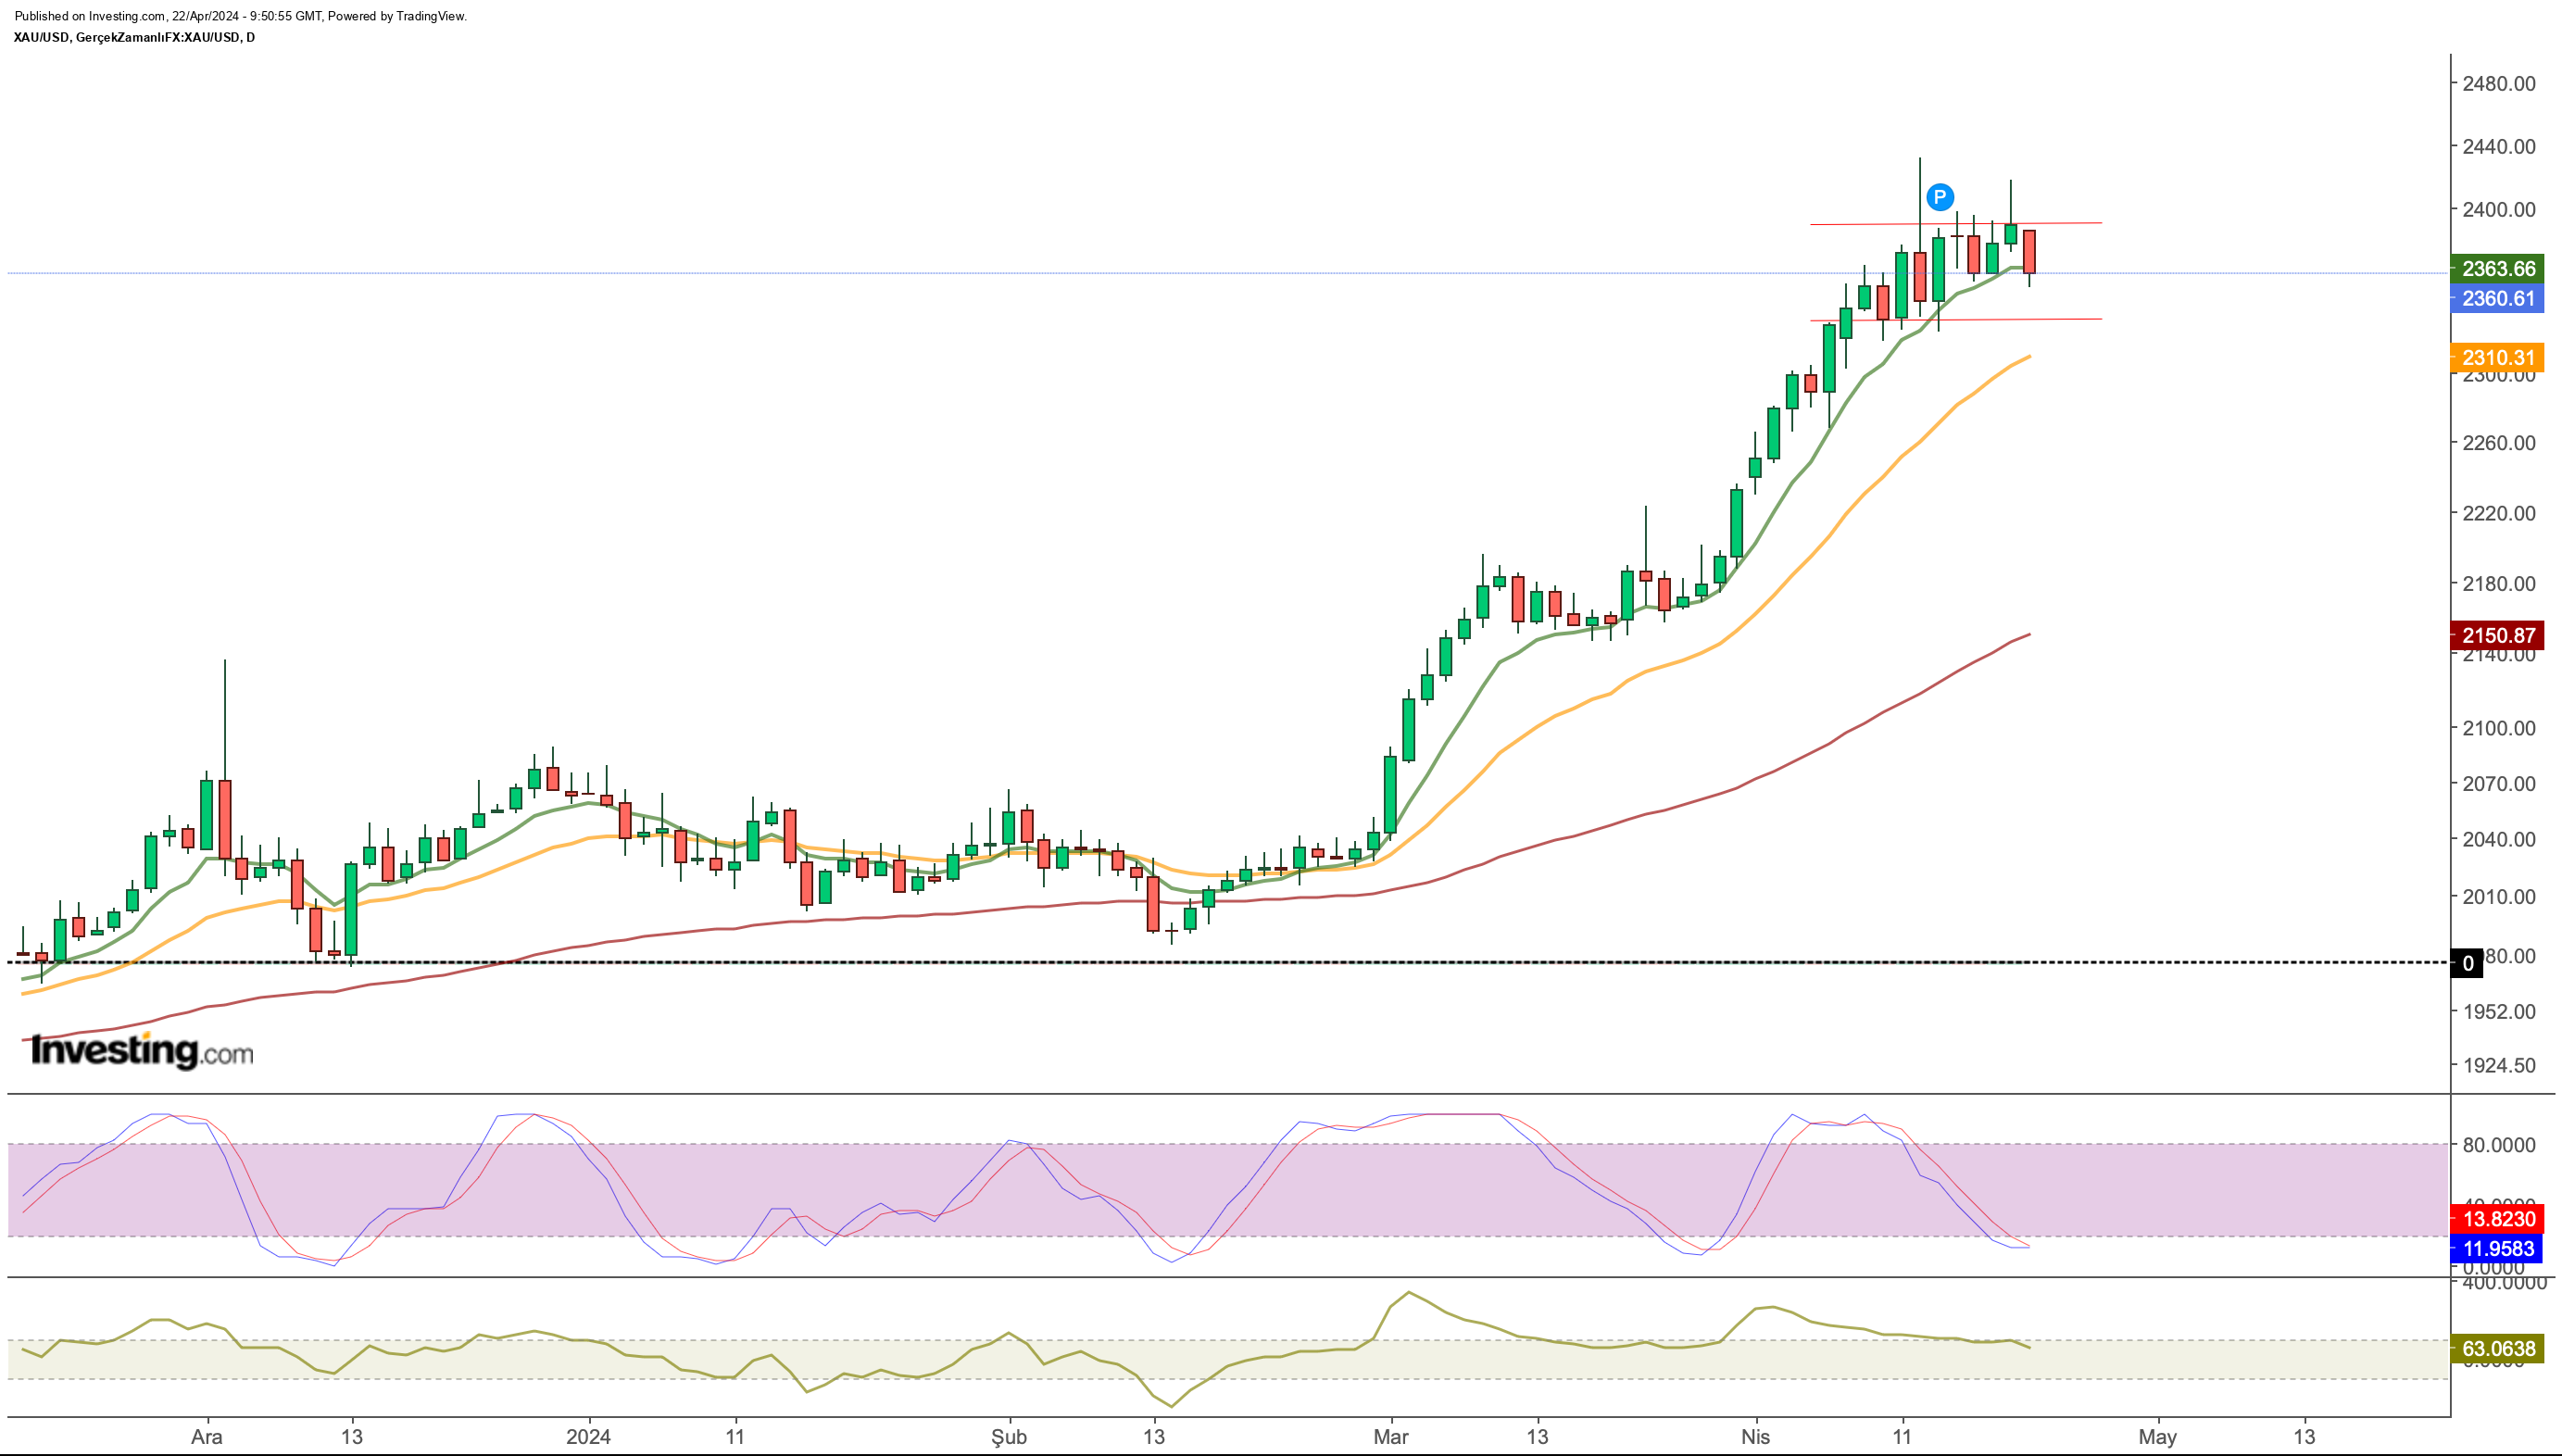
Gold once again proved its status as a safe investment when global risks spiked, hitting $2,431 briefly and reaching a new high.
Gold has been on a winning streak since February, breaking free from its $2,150 - $2,200 range last month. Now, it seems to be settling in the $2,350 - $2,400 zone once more.

Looking at short-term EMA values, the closest support level for gold is around $2,363. If it breaks below that, we might see a pullback towards $2,310.
On the upside, if daily closes exceed $2,420, it could signal more buyers stepping in, keeping the upward trend going.
Essentially, the focus is on gold's stability around the $2,300 mark, with a potential trend forming based on its movement out of this range.
***
Take your investing game to the next level in 2024 with ProPicks
Institutions and billionaire investors worldwide are already well ahead of the game when it comes to AI-powered investing, extensively using, customizing, and developing it to bulk up their returns and minimize losses.
Now, InvestingPro users can do just the same from the comfort of their own homes with our new flagship AI-powered stock-picking tool: ProPicks.
With our six strategies, including the flagship "Tech Titans," which outperformed the market by a lofty 1,745% over the last decade, investors have the best selection of stocks in the market at the tip of their fingers every month.
Subscribe here and never miss a bull market again!
Disclaimer: This content, which is prepared purely for educational purposes, cannot be considered as investment advice. We also do not provide investment advisory services.

