- With tensions escalating between Iran and Israel, traders closely monitored Iran's response over the weekend, affecting assets like gold and the US dollar.
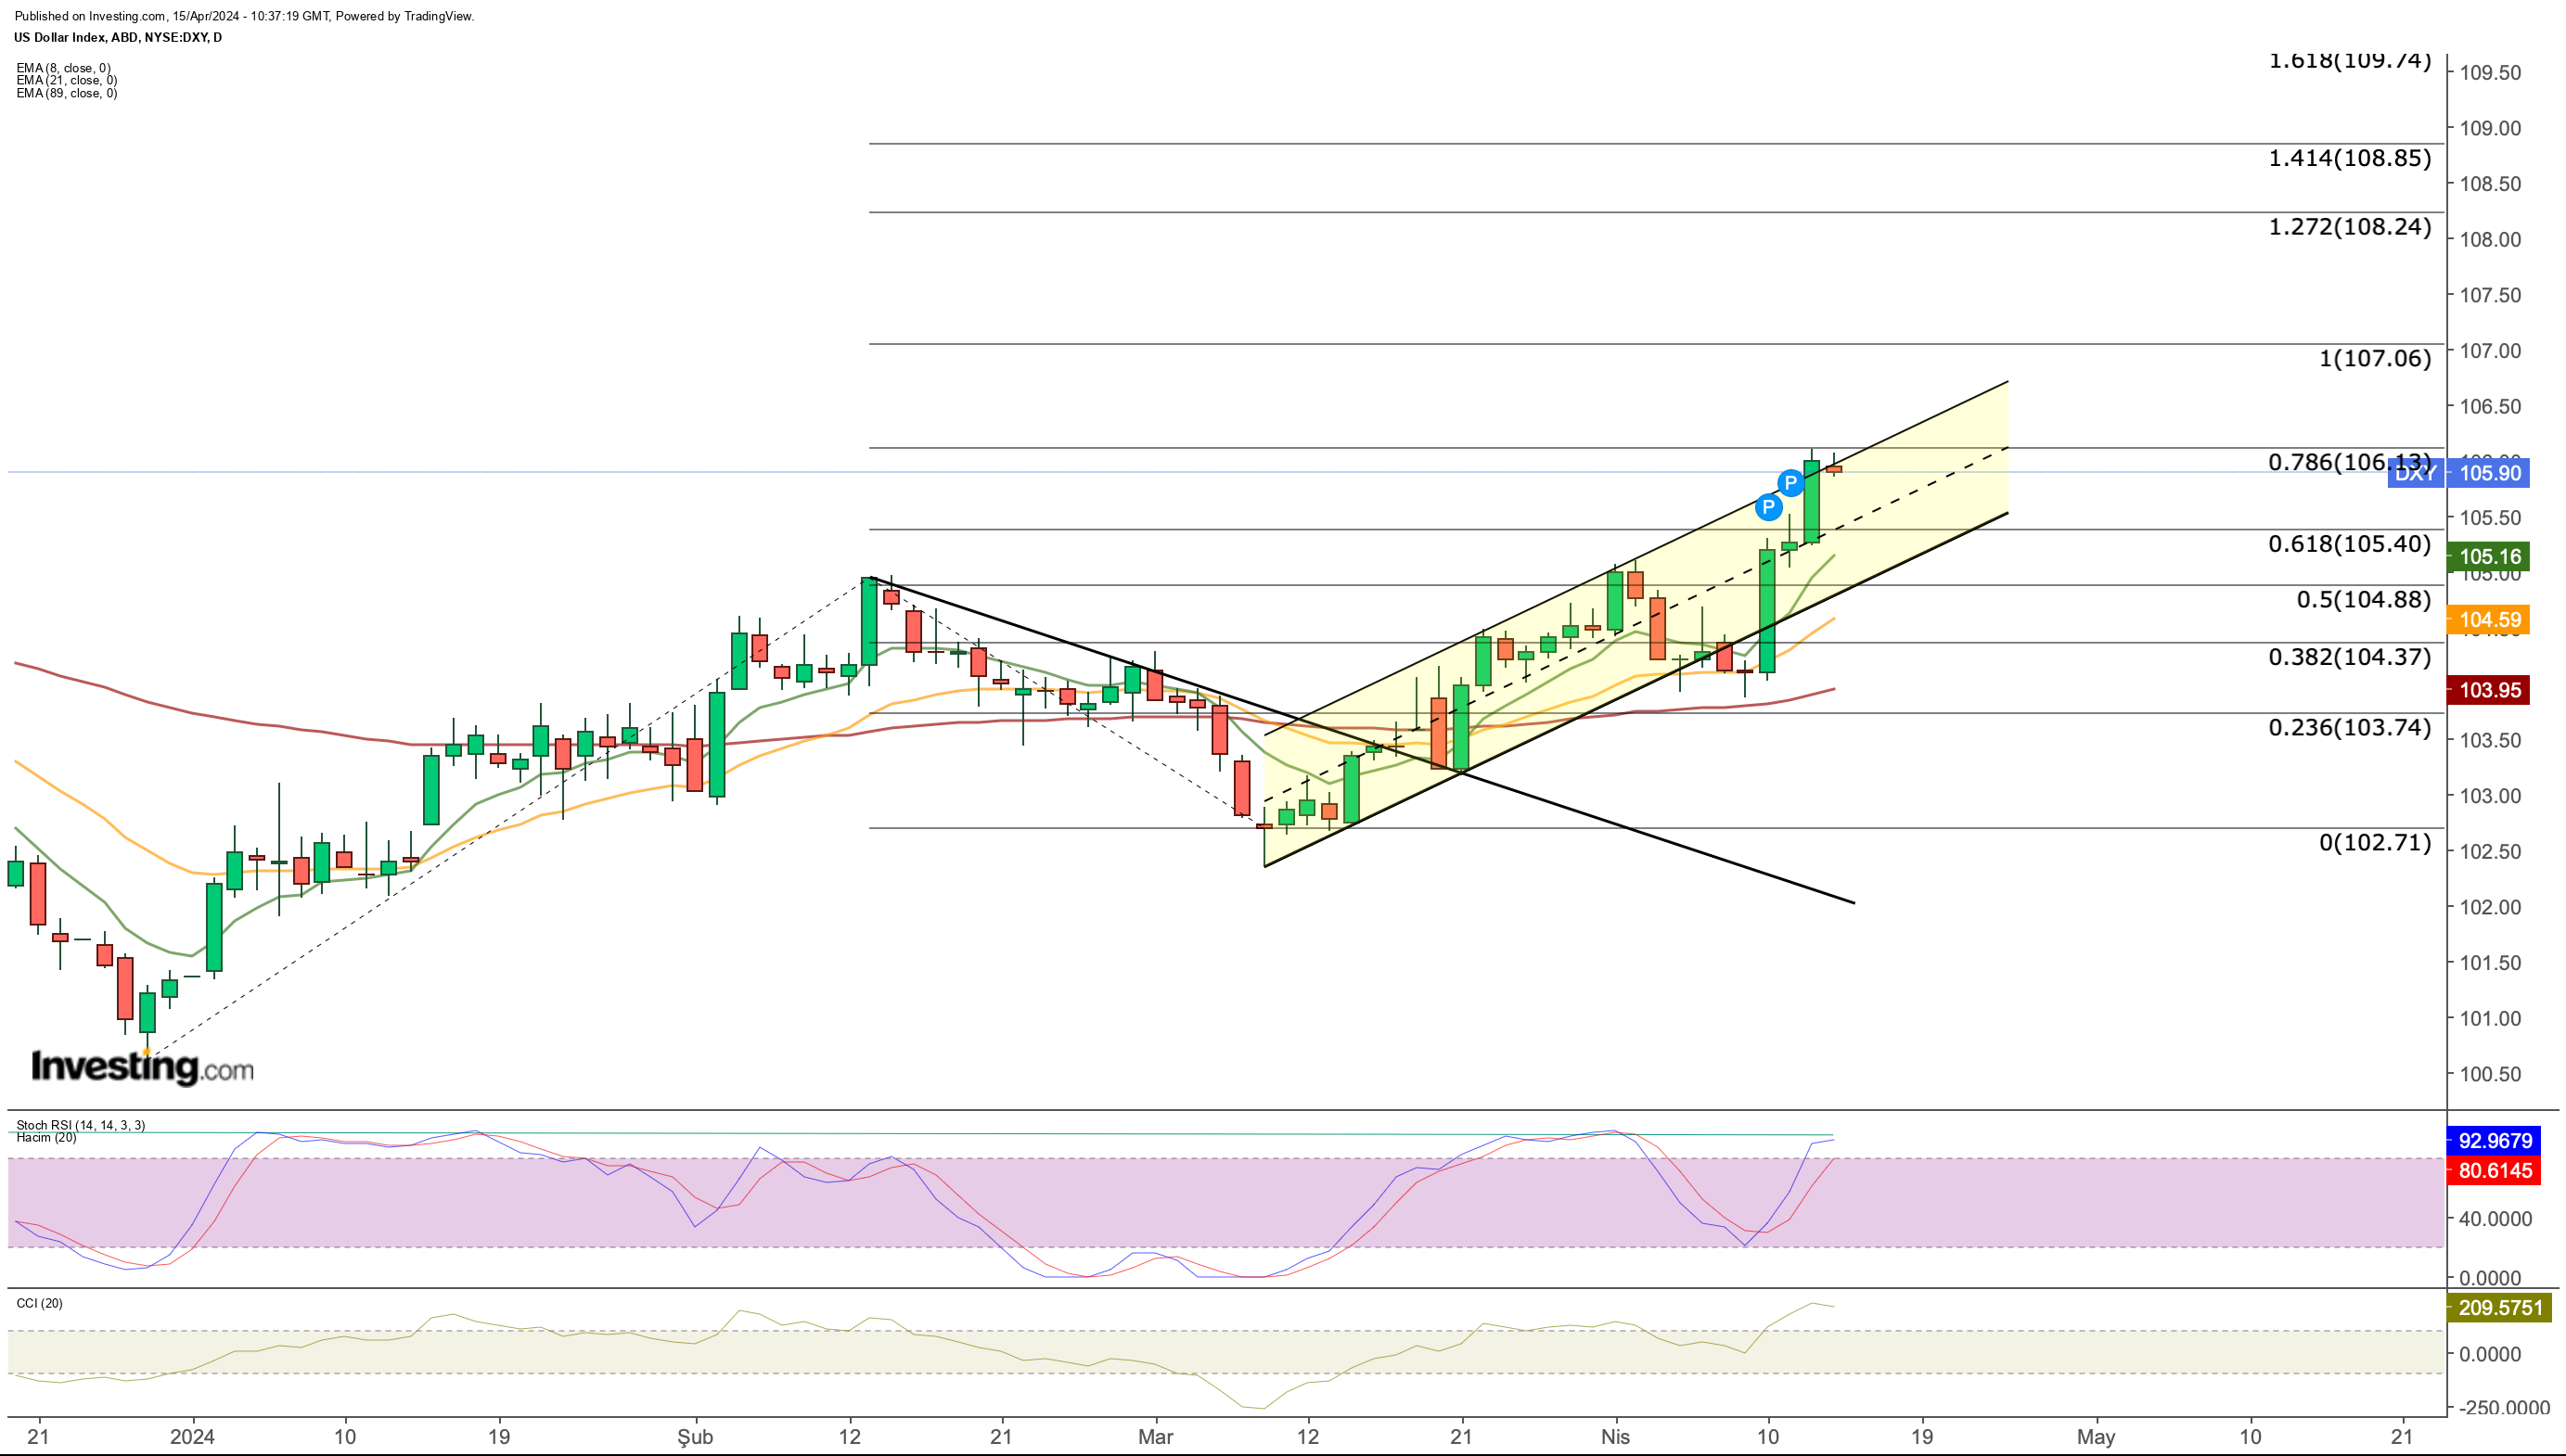
- Last week, the DXY surged to 105 after the inflation data release, inching toward 106 amid increased demand for the dollar due to risk aversion, driven by Federal Reserve statements.
- Testing the upper boundary on the daily chart, the DXY held firm against Fibonacci resistance, eyeing potential breakout targets at 107 and 108.2, contingent on economic data and Fed actions.
- Invest like the big funds for less than $9 a month with our AI-powered ProPicks stock selection tool. Learn more here>>
Rising tensions between Iran and Israel have pushed traders into gold and the US dollar over the weekend. However, as the market begins to digest the tragic attack, both safe heavens appear to be consolidating this morning.
Last week, the DXY rose to 105 following the release of inflation data. By the end of the week, the DXY began to approach the 106 mark as demand for the dollar increased due to risk aversion, fueled by statements from Federal Reserve officials.
Testing the upper boundary of the upward trend on the daily chart, the DXY also held firm against the 0.786 Fibonacci resistance level in line with the trend observed since 2024.

In a potential breakout, the next target levels appear to be 107 and then 108.2. The dollar's direction will mostly rely on economic data and the Fed's actions in the next few months.
If the Fed lowers rates in the latter part of the year, the DXY might decrease. From a technical standpoint, the range between 104.8 and 105.4 stands out in the short term.
If this range is broken, the market could see it as a shift in trend. This might lead to a pullback toward 103 levels.
Gold: Buying Opportunities Loom
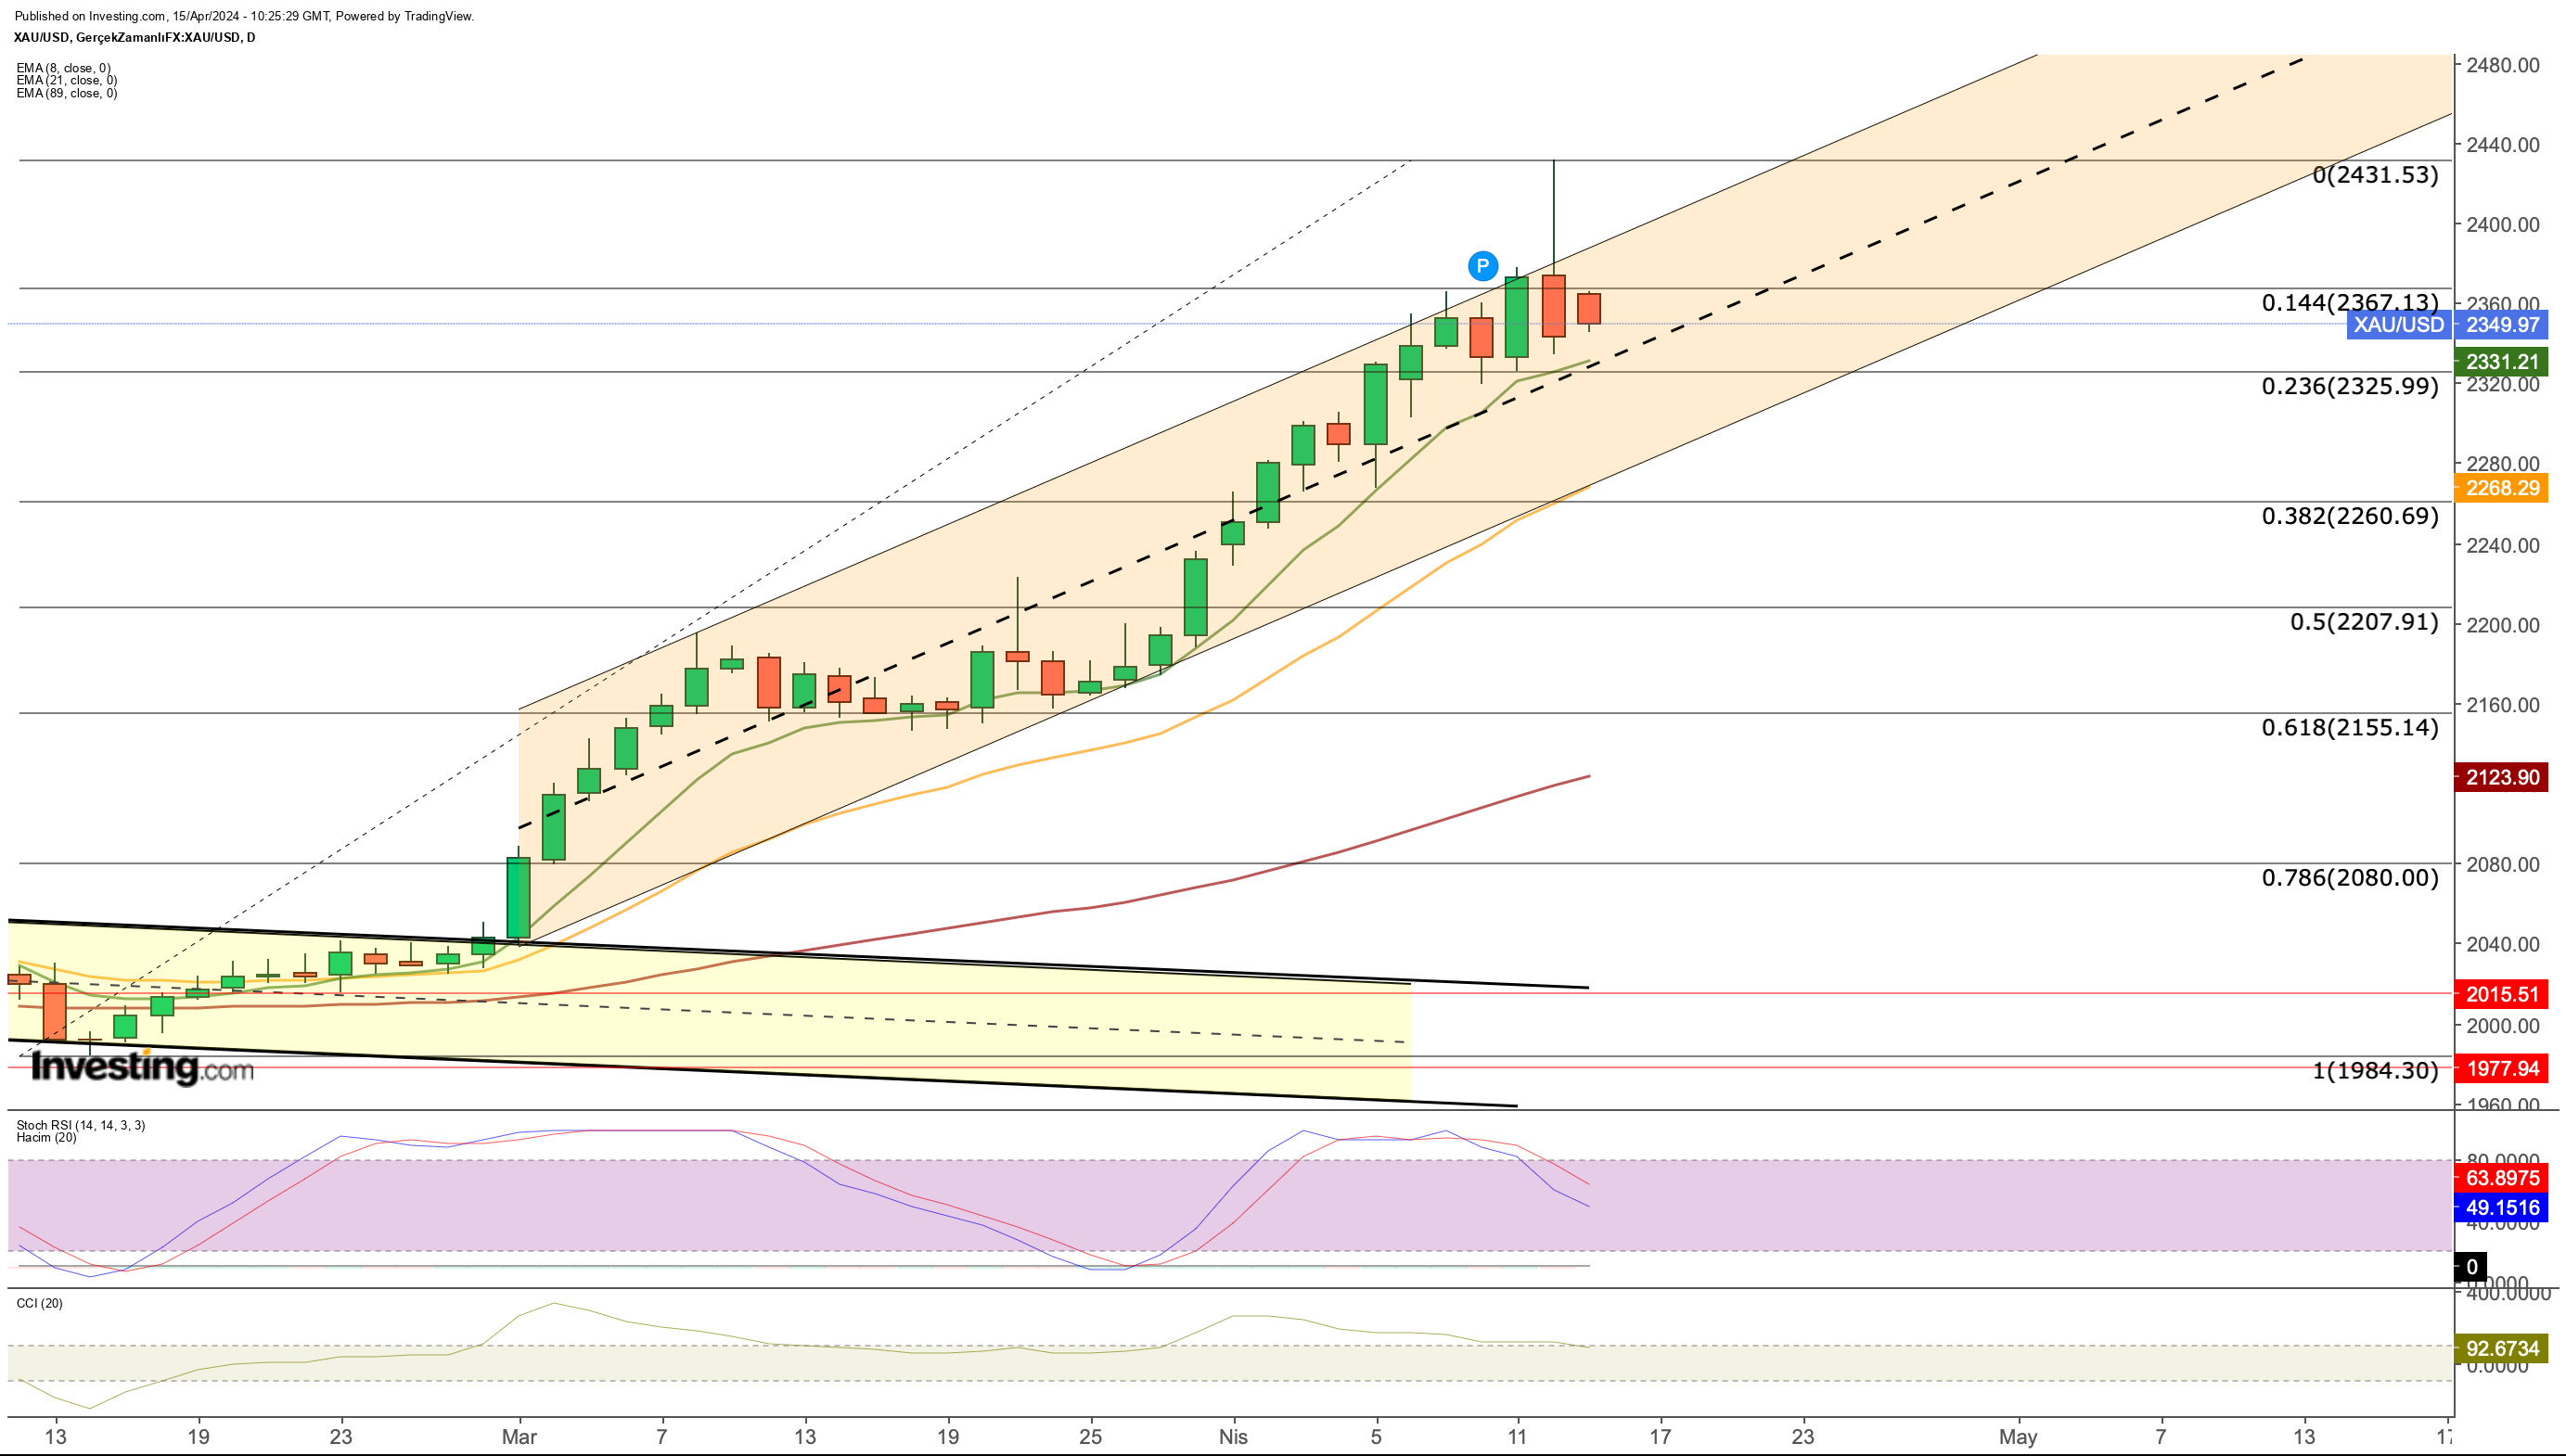
Gold reached a new all-time high of $2,431 on Friday. However, by the end of the week, sales during US trading hours caused gold to close at $2,343, marking a loss of over 1%.
Currently, gold seems uncertain, influenced by two main factors. Firstly, there's a belief that the Federal Reserve's plan to lower interest rates, despite tensions in the Middle East, might not meet expectations.
This could potentially put pressure on gold in the upcoming days. Secondly, last week, US inflation once again surpassed expectations, suggesting that the dollar will remain attractive for a longer time.
Nonetheless, concerns over geopolitical risks, which are given more importance, continue to support gold's upward trend as a safe-haven asset.

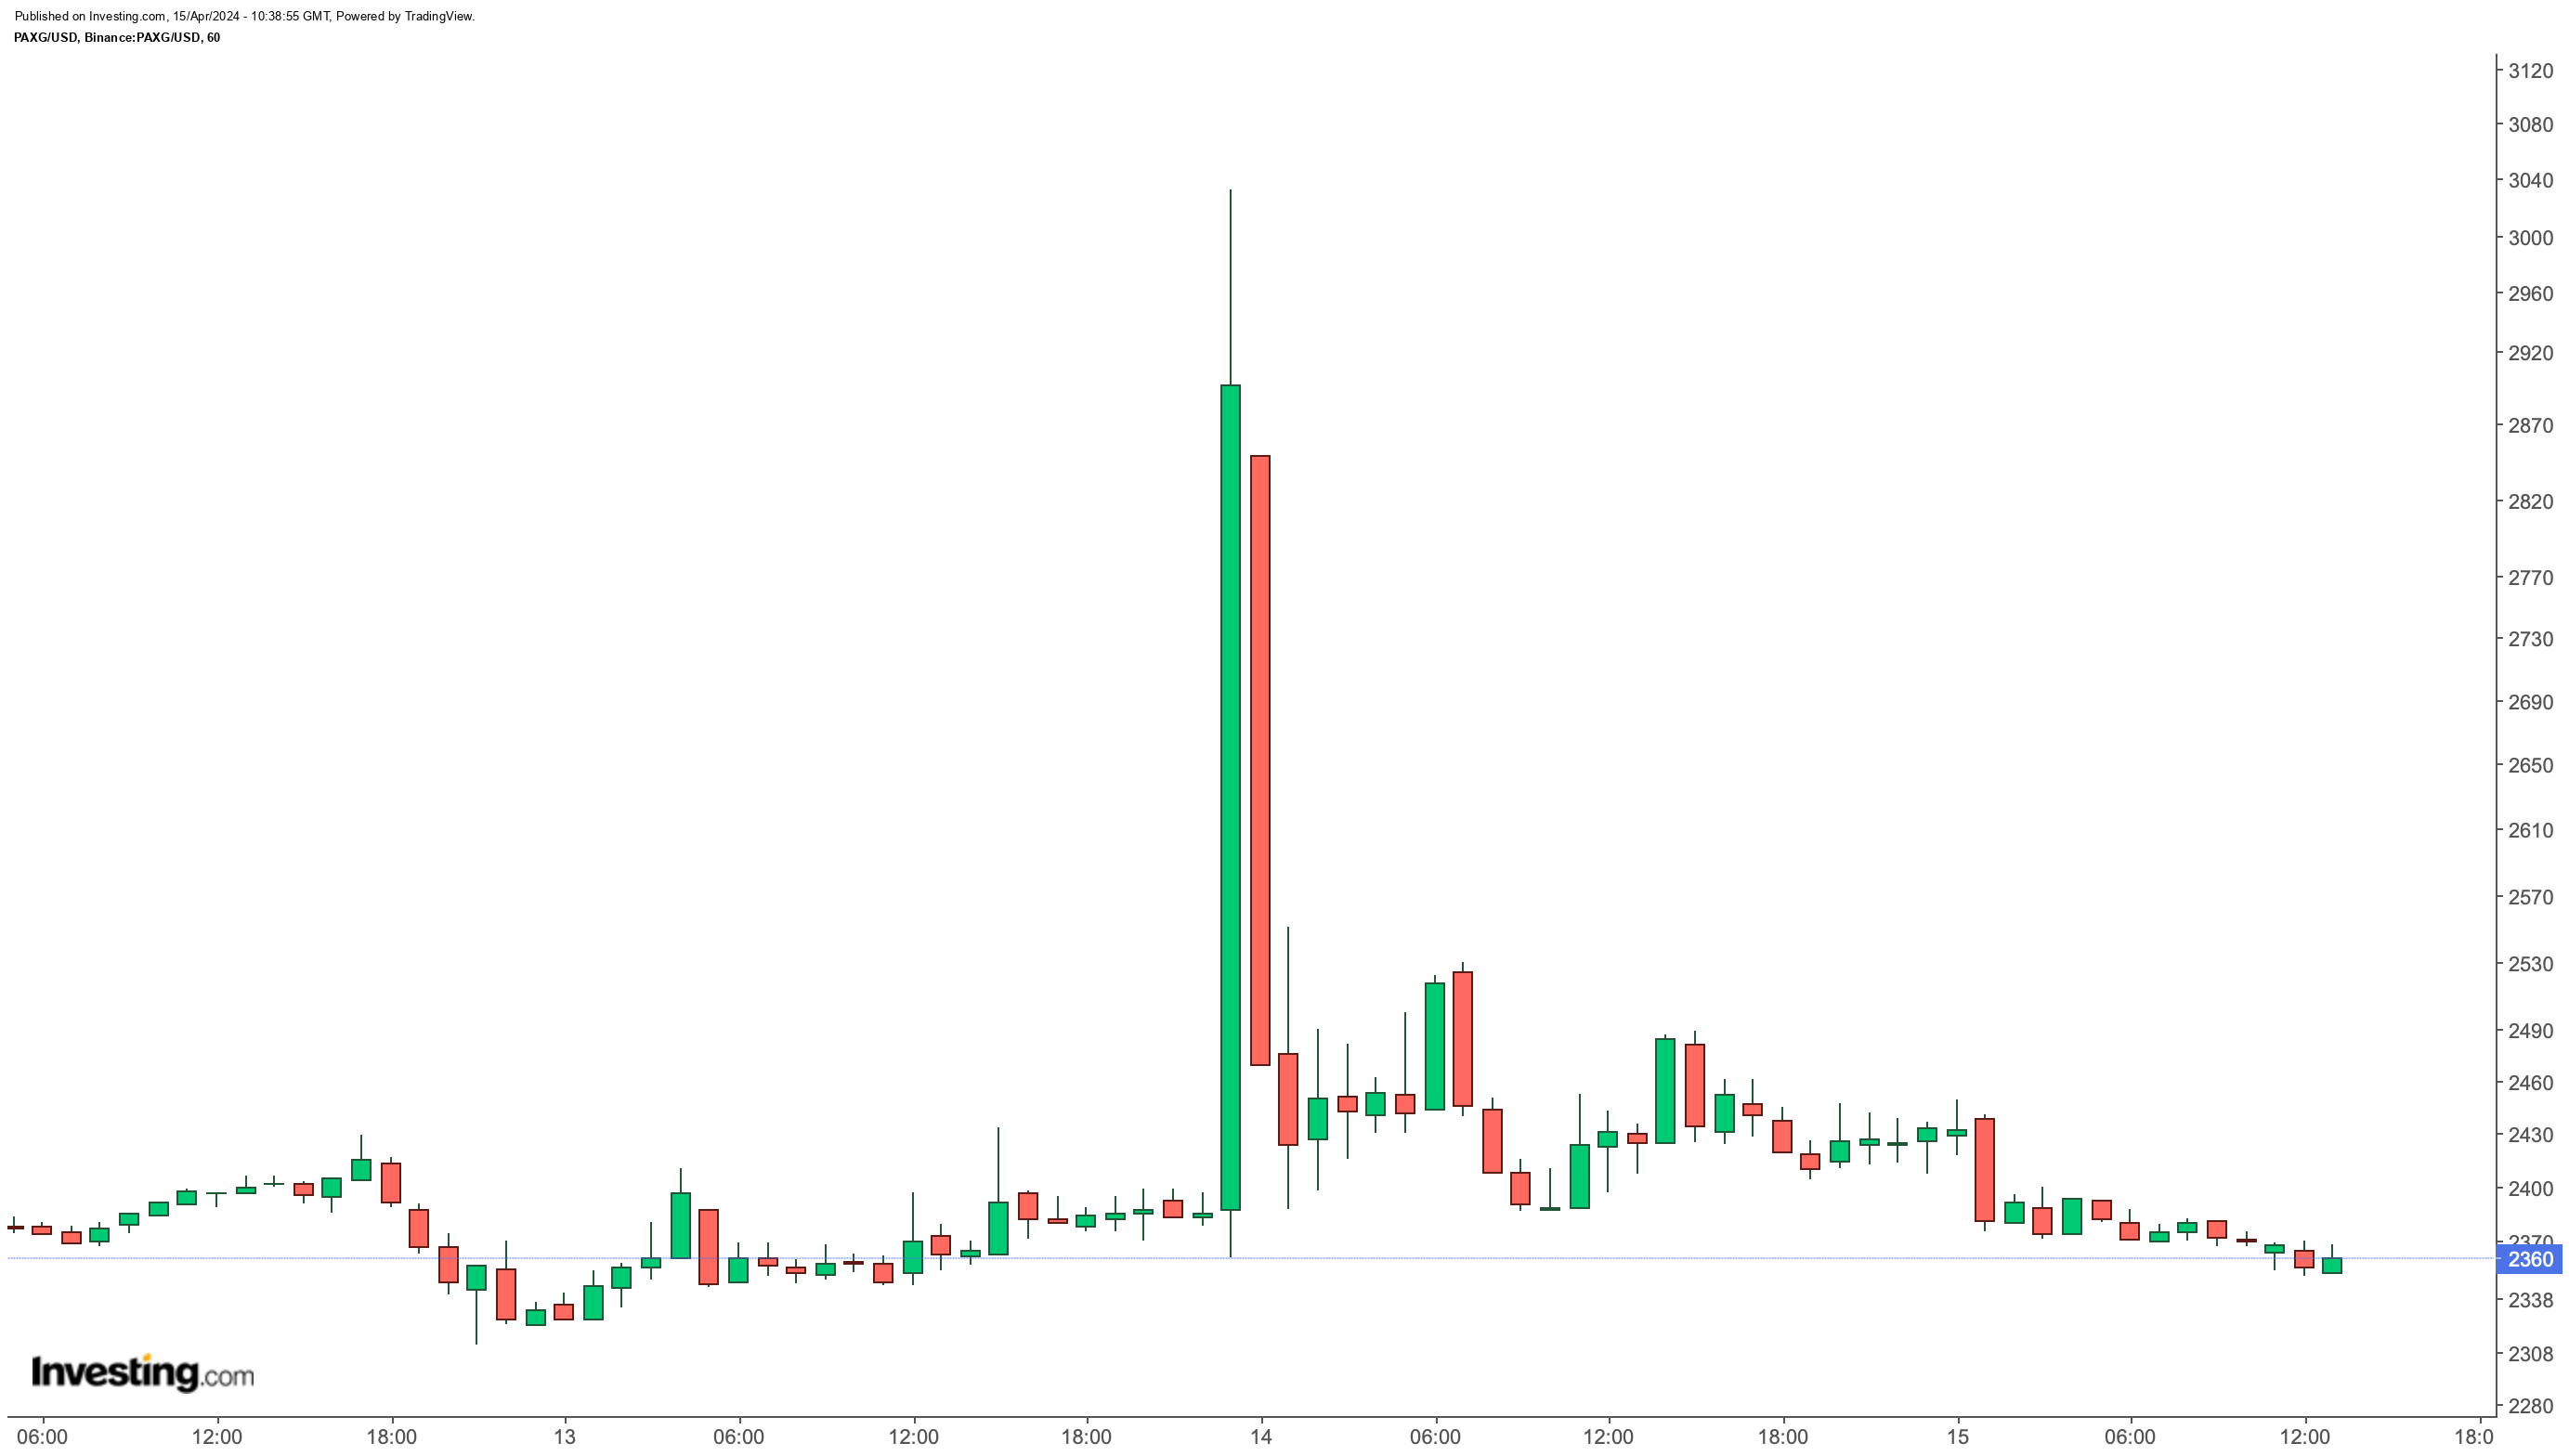
During the weekend Iran launched the attack, the gold market was closed. PAXG/USD, a cryptocurrency linked to gold, gave clues about how the market digested the news.
When the Iranian attack started, PAXG shot up to $3,295. This suggests how much demand for gold could rise if the attack happened when markets were open.
After the surge, PAXG returned to normal. It tried to hit $2,500 over the weekend. But as tensions eased with measured responses from Iran and messages from the UN, the markets calmed down.
At the beginning of the week, gold saw some selling at around $2,360. But it's still on an upward trend due to strong demand from central banks and the potential for more geopolitical problems, as we've seen recently.

Investors might see dips in the rising gold price as chances to buy, even though gold has gone up by almost 14% since the year began.
Right now, the weekly chart shows a strong support level at $2,325. On the other side, $2,370 seems like the highest point before gold settles around $2,400.
This zone has been where gold's performance has gotten weaker lately. If tensions ease in the Middle East, we might test that $2,325 support.
While a drop to $2,260 is possible if there's a big change, it's not very likely considering how things are now. This makes it more probable that gold will keep going up if it stays above $2,325.
***
Take your investing game to the next level in 2024 with ProPicks
Institutions and billionaire investors worldwide are already well ahead of the game when it comes to AI-powered investing, extensively using, customizing, and developing it to bulk up their returns and minimize losses.
Now, InvestingPro users can do just the same from the comfort of their own homes with our new flagship AI-powered stock-picking tool: ProPicks.
With our six strategies, including the flagship "Tech Titans," which outperformed the market by a lofty 1,745% over the last decade, investors have the best selection of stocks in the market at the tip of their fingers every month.
Subscribe here and never miss a bull market again!
Disclaimer: This content, which is prepared purely for educational purposes, cannot be considered as investment advice. We also do not provide investment advisory services.

