Investing.com’s stocks of the week
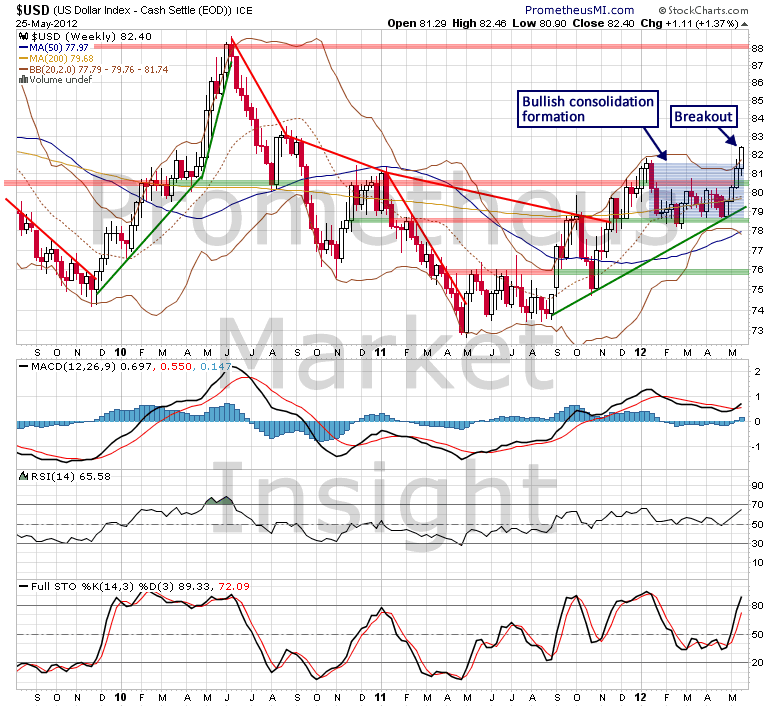
At the beginning of May, we identified the potential development of a bullish consolidation formation for the US dollar index that would favor the resumption of the rally from August 2011. The consolidation formation developed as expected and the index closed well above the previous rally high this week, signaling the highly likely resumption of the uptrend.

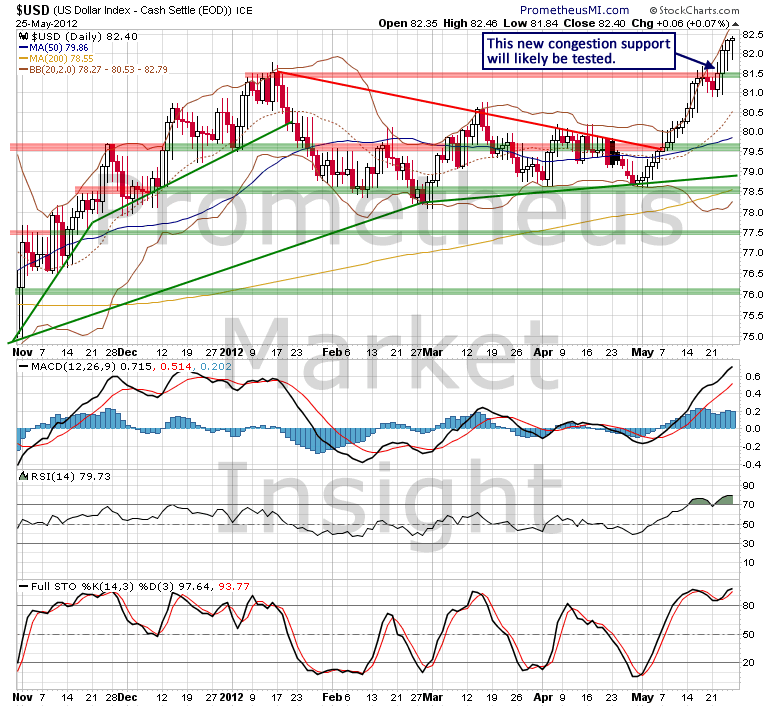
In general, breakouts have a tendency to test the new congestion support that forms at the top of the previous formation, so it would not be unusual for the index to return to the 81.50 area before moving substantially higher. However, a successful test of congestion support at 81.50 would almost certainly be followed by substantial, additional gains.

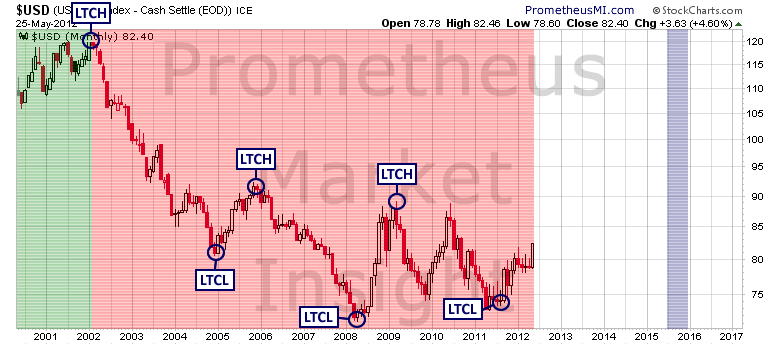
From a big picture perspective, the advance off of the last long-term cycle low (LTCL) that we identified in September continues to gain strength and a subsequent return to the previous long-term cycle high (LTCH) near 88 would suggest that cycle translation is in question.

The US dollar continues to experience violent swings higher and lower as the structural conflict between deflation and inflation rages on.
Considering the unprecedented liquidity operation that the Federal Reserve continues to engage in, it will be interesting to see how far and long the current rally is able to proceed. As always, judiciously applied chart analysis will enable us to identify the key market developments as they occur. We will identify the key developments as they occur in our daily market forecasts and signal notifications.

In general, breakouts have a tendency to test the new congestion support that forms at the top of the previous formation, so it would not be unusual for the index to return to the 81.50 area before moving substantially higher. However, a successful test of congestion support at 81.50 would almost certainly be followed by substantial, additional gains.

From a big picture perspective, the advance off of the last long-term cycle low (LTCL) that we identified in September continues to gain strength and a subsequent return to the previous long-term cycle high (LTCH) near 88 would suggest that cycle translation is in question.

The US dollar continues to experience violent swings higher and lower as the structural conflict between deflation and inflation rages on.
Considering the unprecedented liquidity operation that the Federal Reserve continues to engage in, it will be interesting to see how far and long the current rally is able to proceed. As always, judiciously applied chart analysis will enable us to identify the key market developments as they occur. We will identify the key developments as they occur in our daily market forecasts and signal notifications.
