The two charts below, Construction Spending Total, Residential, Commercial and Public, reflect significant improvements in our economy. They have been slow in finding and moving off their lows, but they are certainly developing uptrends today. Construction is a huge jobs multiplier as the number of individuals hired in direct construction activity impacts multiple related goods and service sectors. A study by the Mtg Bankers Assoc estimated that each Residential Construction hire resulted in 7-8 additional hires in related areas of the economy, i.e. mining, lumber, real estate brokers, attorneys, furniture and appliance mfg and retail and etc. Today each home carries an avg. $260,000 price tag. This is more often than not a levered purchase, using the mtg markets. Banks (XLF) cannot lend if both short and long rates are so low that lending spreads don't cover expenses and potential default risk. BUT, as rates rise in the beginning of a cycle, the long rates rise faster than the short term rates and bank lending spreads improve. Bank lending activity picks up early in the real estate cycle. It is only as the real estate markets mature, when rising short term rates vs. long term rates cause lending spreads to narrow, that bank lending spreads no longer cover expenses and default risk and lending activity slows.
The Construction Spending Total, Residential, Commercial and Public chart is an estimate of the TTM monthly(Trailing Twelve Months) spend, i.e. at the peak in Feb 2006 just over $1,200,000 million was spent on Total Construction Spending. This represented 8.6% of the $13.8Trillion in GDP reported for the 1Q2006.
1) Peak TTM monthly Total Construction Spend in the last cycle occurred February 2006 at $1.2 Trillion!!
2) Residential Construction spending at the peak was ~55.5% of the total.
3) Residential Construction is leading Total Construction Spending in the current cycle.
4) Commercial Construction is flat.
5) Public Construction, i.e. spending on highways, public projects has been down since Jan 2009-Government spending has been flat for several years(see email sent several weeks ago)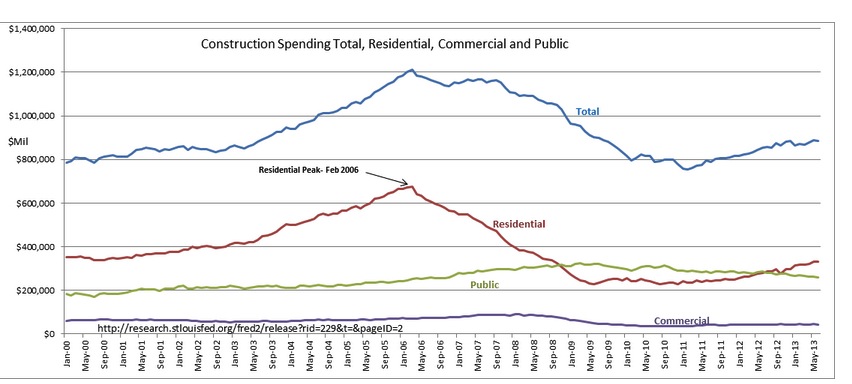
The June 2013 ABI chart reflects increasing activity for architectural design services with all sectors of the economy showing improvement (see post here). In particular the demand for Residential design services has been the strongest sector having been consistently above 50 since June 2012. Lately, the demand for Institutional and Commercial design services are picking up. All regions of the country are participating with a typical weather pattern connected level of activity, i.e. stronger in the South, Mid-West initially stronger, but suffering from difficult weather conditions in May 2013 but now in an apparent rebound.
Residential Housing activity has a significant impact on our economy. All indicators show continued improvement and recent ABI Inquiries forecast higher Total Construction Spending in future months. I expect to see significant improvements in Construction Employment in the coming months, accelerated economic activity and higher equity prices.
The trends in construction spending indicate a good period for equity investors. One can estimate that markets still have 5yrs-6yrs of equity price increases all things being equal
Disclaimer: The information in this blog post represents my own opinions and does not contain a recommendation for any particular security or investment. I or my affiliates may hold positions or other interests in securities mentioned in the Blog, please see my Disclaimer page for my full disclaimer.
- English (UK)
- English (India)
- English (Canada)
- English (Australia)
- English (South Africa)
- English (Philippines)
- English (Nigeria)
- Deutsch
- Español (España)
- Español (México)
- Français
- Italiano
- Nederlands
- Polski
- Português (Portugal)
- Português (Brasil)
- Русский
- Türkçe
- العربية
- Ελληνικά
- Svenska
- Suomi
- עברית
- 日本語
- 한국어
- 简体中文
- 繁體中文
- Bahasa Indonesia
- Bahasa Melayu
- ไทย
- Tiếng Việt
- हिंदी
US Construction Spending Rising
Published 08/06/2013, 07:21 AM
Updated 07/09/2023, 06:31 AM
US Construction Spending Rising
Latest comments
Loading next article…
Install Our App
Risk Disclosure: Trading in financial instruments and/or cryptocurrencies involves high risks including the risk of losing some, or all, of your investment amount, and may not be suitable for all investors. Prices of cryptocurrencies are extremely volatile and may be affected by external factors such as financial, regulatory or political events. Trading on margin increases the financial risks.
Before deciding to trade in financial instrument or cryptocurrencies you should be fully informed of the risks and costs associated with trading the financial markets, carefully consider your investment objectives, level of experience, and risk appetite, and seek professional advice where needed.
Fusion Media would like to remind you that the data contained in this website is not necessarily real-time nor accurate. The data and prices on the website are not necessarily provided by any market or exchange, but may be provided by market makers, and so prices may not be accurate and may differ from the actual price at any given market, meaning prices are indicative and not appropriate for trading purposes. Fusion Media and any provider of the data contained in this website will not accept liability for any loss or damage as a result of your trading, or your reliance on the information contained within this website.
It is prohibited to use, store, reproduce, display, modify, transmit or distribute the data contained in this website without the explicit prior written permission of Fusion Media and/or the data provider. All intellectual property rights are reserved by the providers and/or the exchange providing the data contained in this website.
Fusion Media may be compensated by the advertisers that appear on the website, based on your interaction with the advertisements or advertisers.
© 2007-2025 - Fusion Media Limited. All Rights Reserved.