US economic growth has slowed recently and several key economic indicators are painting a mixed profile about the near-term outlook. The modestly wobbly numbers of late have convinced some analysts to warn that a recession is near. Perhaps, but the data overall still aligns with a moderate expansion and an econometric projection of the macro trend. A broad set of indicators listed below demonstrates a low probability of a downturn through July.
Short of a dramatic, sudden economic collapse in the weeks ahead, economic and financial data are telling us that it’s likely that the US economic expansion will become the longest on record next month. If growth prevails through the end of July, which appears probable at this point, the output will mark 121 consecutive monthly increases – one month longer than the 120-month expansion through December 2007 (the current record holder), according to NBER’s accounting, the semi-official scorekeeper of the US business cycle.
The main uncertainty lies beyond next month. Of course, there’s always significant uncertainty beyond a one-to-month projection window. Perhaps the uncertainty on that front is unusually high at the moment, which would explain the growing calls in some circles that a recession is virtually fate by the end of the year or at some point in 2020. Maybe, but let’s be clear: forecasts that far ahead are little more than guesses.
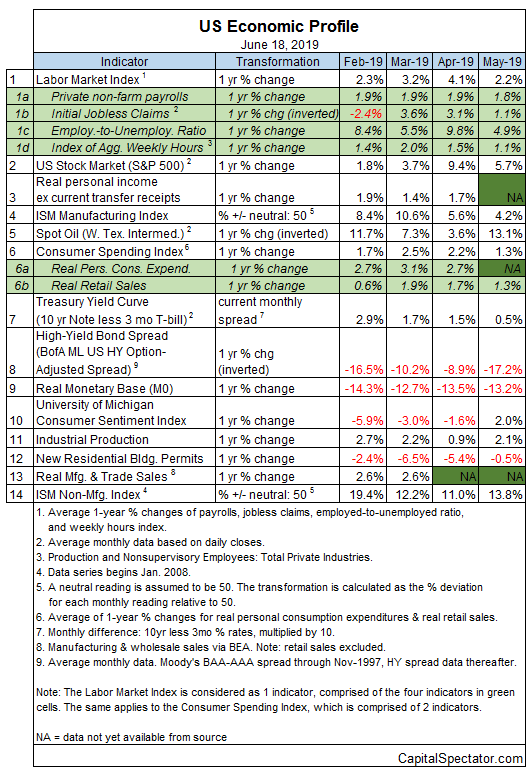
As for profiling the US macro trend and restricting our analysis to high-confidence terrain, let’s start by looking at the data published to date. Using a diversified set of indicators suggests that recession risk remains low as of May, based on The Capital Spectator’s proprietary business-cycle model. Analyzing the data in the table below through this lens reflects a low probability that an NBER-defined downturn has started. (For a more comprehensive review of the macro trend with weekly updates, see The US Business Cycle Risk Report.)
Although several indicators were trending down last month (data in red), it’s notable that only three metrics posted declines in May (vs. four in April), according to the economic reports published to date. That implies that economic conditions stabilized last month. Alternatively, one might say that it doesn’t appear that the recent slowdown in economic activity continued to deteriorate in May.

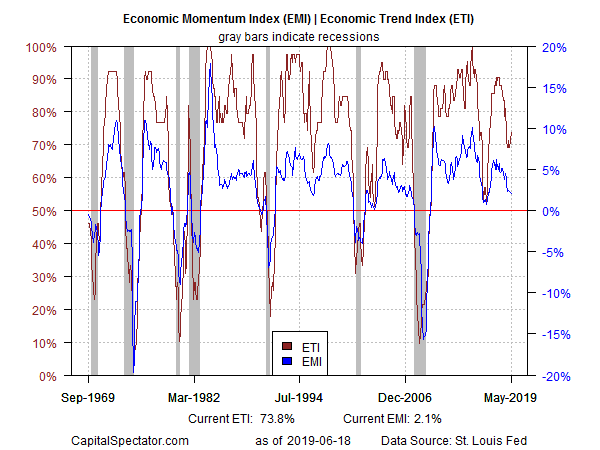
For a deeper context, let’s consider the aggregated profile of the indicators in the table above via two benchmarks. The Economic Trend Index (ETI) – a business-cycle index that tracks 14 indicators that collectively capture a broad snapshot of US economic activity – continues to show signs of stabilizing in the low-70% range (see chart below). This reading is well above the 50% tipping-point mark (readings below 50% indicate recession). Note, however, that filtering the same data set through another econometric lens – the Economic Momentum Index (EMI) – shows that the trend is still weakening, albeit marginally. EMI is still moderately above its 0% tipping point, but the gradually falling trend in recent history is worrisome… if it continues.

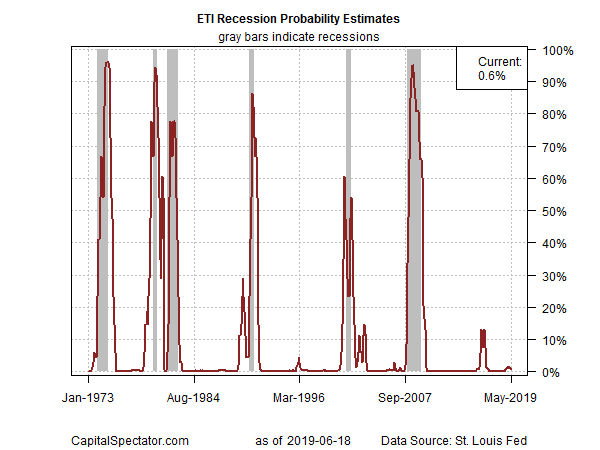
ETI’s results, however, continue to offer a strong signal that recession risk is low. Translating the index’s historical values into recession-risk probabilities with a probit model points to low business-cycle risk for the US through last month. Analyzing the data through this lens indicates that the odds remain virtually nil — roughly 1% — that NBER will declare May as the start of a new recession. Note, too, that a probit-model reading of EMI (not shown) also shows a low probability (5%) that the economy was contracting last month.

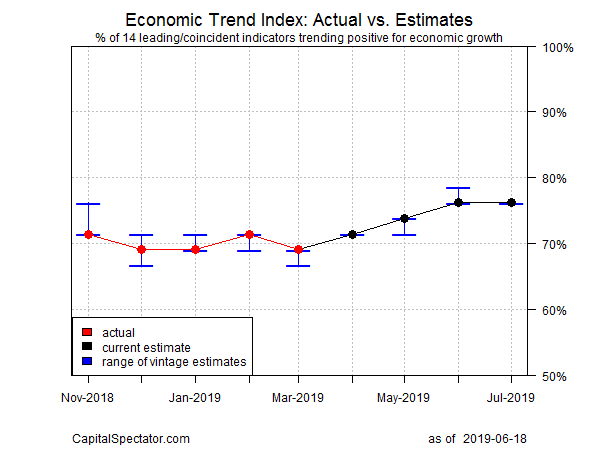
Turning to the near-term outlook, consider how ETI may evolve as new data is published. One way to project values for this index is with an econometric technique known as an autoregressive integrated moving average (ARIMA) model, based on default calculations via the “forecast” package in R. The ARIMA model calculates the missing data points for each indicator for each month — in this case through July 2019. (Note that March 2019 is currently the latest month with a complete set of published data for ETI.) Based on today’s projections, ETI is expected to hold steady through July at a level that reflects moderate economic growth.

Forecasts are always suspect, but recent projections of ETI for the near-term future have proven to be reliable guesstimates vs. the full set of published numbers that followed. That’s not surprising, given ETI’s design to capture the broad trend based across multiple indicators. Predicting individual components in isolation, by contrast, is subject to greater uncertainty. The assumption here is that while any one forecast for a given indicator will likely be wrong, the errors may cancel out to some degree by aggregating a broad set of predictions. That’s a reasonable view, based on the generally accurate historical record for the ETI forecasts in recent years.
The current projections (the four black dots in the chart immediately above) suggest that the economy will continue to expand through next month. The chart also shows the range of vintage ETI projections published on these pages in previous months (blue bars), which you can compare with the actual data (red dots) that followed, based on current numbers.
For more perspective on the track record of the ETI forecasts, here are the vintage projections for the past three months:
