A broad measure of U.S. investment-grade bonds rallied to a new high last week as stocks around the world slumped, based on a set of exchange-traded products that track the major asset classes. The return of risk-off sentiment was fueled in part by Friday’s surprisingly weak report on U.S. payrolls growth in February.
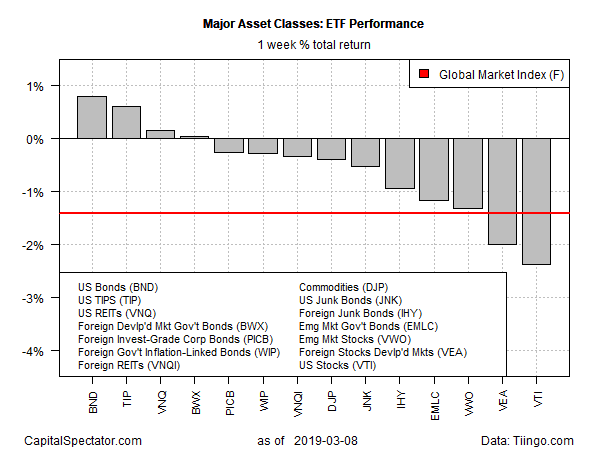
The soft economic data helped to fuel buying in Vanguard Total Bond Market (NYSE:BND), the strongest performer for the major asset classes for the trading week through March 8. BND’s weekly 0.8% gain last week marks the sixth advance over the past seven weeks.
The weakest performer last week: Vanguard Total Stock Market (NYSE:VTI). The ETF fell a hefty 2.4%, the first weekly slide for VTI since late-January.
Despite growing worries about the U.S. economy, Federal Reserve Chairman Jerome Powell downplayed the potential for macro risk in an interview with “60 Minutes” on Sunday. “I would say there’s no reason why this economy cannot continue to expand,” he said.
Nevertheless, the risk-off sentiment weighed on an ETF-based version of the Global Markets Index (GMI.F) last week. This investable, unmanaged benchmark that holds all the major asset classes (except cash) in market-value weights fell 1.4% — the benchmark’s first weekly decline since the first week of February.
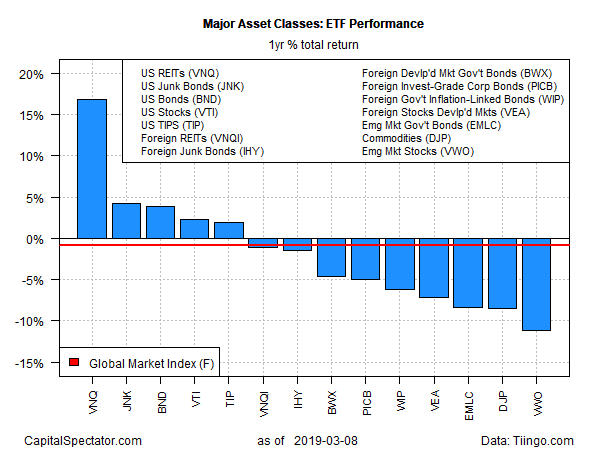
For the one-year return window, U.S. real estate investment trusts continue to dominate by a wide margin. Vanguard REIT (NYSE:VNQ) is up a strong 16.7% over the trailing 12 months, based on total return. The second-strongest performance for the major asset classes for one-year results is a distant 4.1% via SPDR Bloomberg Barclays High Yield Bond (NYSE:JNK).
The weakest performer for the major asset classes over the past year: emerging market stocks. Vanguard Emerging Markets (NYSE:VWO) has lost 11.2% as of Friday’s close vs. the year-earlier price on a total-return basis.
GMI.F’s one-year performance reflects a mild 0.8% decline.
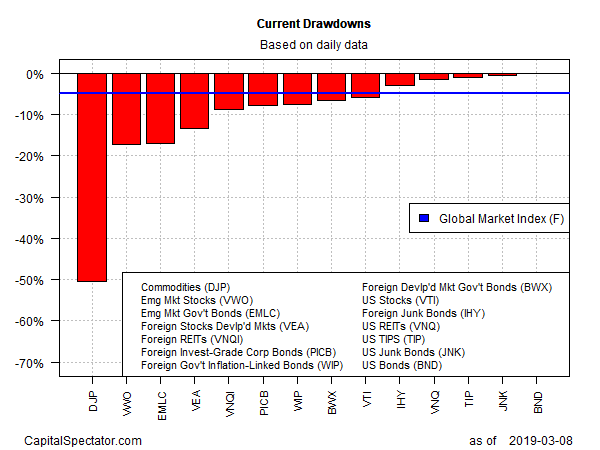
Ranking the major asset classes by current drawdown shows that US investment-grade bonds are leading the field with a zero peak-to-trough decline as of Friday’s close.
Meantime, a broadly defined measure of commodities continues to wallow in last place for drawdown. The iPath Bloomberg Commodity (NYSE:DJP) is currently posting a roughly 50% tumble from its previous peak — the steepest slide on this front among the major asset classes.
GMI.F’s current drawdown: -4.8%.