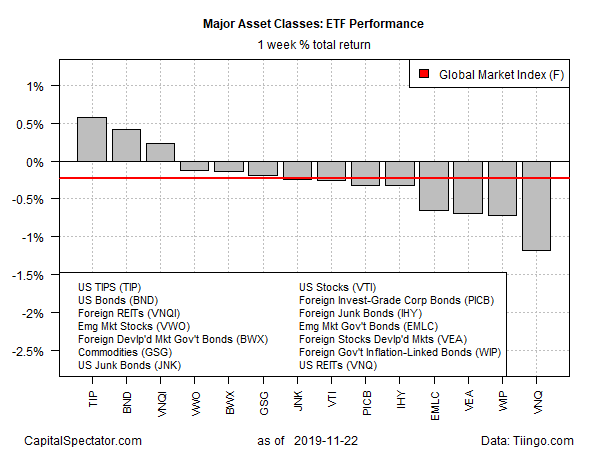
Most of the major asset classes lost ground last week, according to a set of exchange-traded funds. Bucking the downside trend: US investment-grade bonds and foreign real estate shares. Otherwise, red ink prevailed in global markets over the five days of trading through Nov. 22.
Last week’s top performer: iShares TIPS Bond ETF (NYSE:TIP). The fund, which targets inflation-indexed Treasuries, rose 0.6%, lifting the ETF close to its highest level since early October. So far in 2019, TIP is up 8.1%.
Also in the winner’s circle last week: a broad measure of investment-grade US bonds (Vanguard Total Bond Market Index Fund ETF Shares (NYSE:BND) and a portfolio of foreign real estate shares Vanguard Global ex-U.S. Real Estate Index (NASDAQ:VNQI)
Losses dominated the rest of the major asset classes, led by US REITs via Vanguard Real Estate Index (NYSE:VNQ), which eased 1.2% last week. For the year to date, however, VNQ continues to post a strong 25.8% gain after factoring in distributions.

Widespread selling in markets last week, however, weighed on an ETF-based version of the Global Market Index (GMI.F) — an unmanaged benchmark that holds all the major asset classes (except cash) in market-value weights. GMI.F shed 0.2% – the first weekly setback for the index in nearly two months.
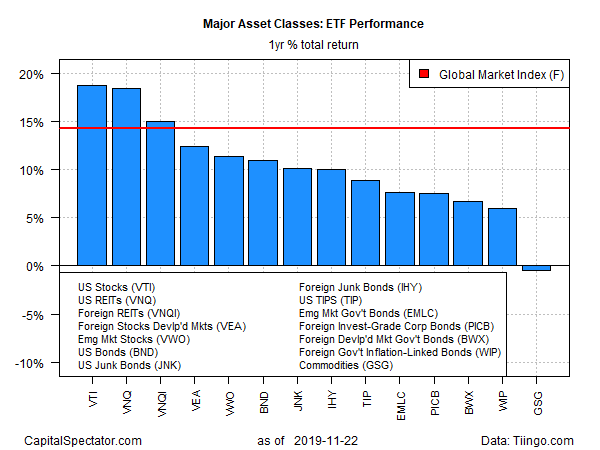
For the one-year trend, US stocks and US REITs are in a virtual dead-heat for the top performance among the major asset classes. Ahead by a hair: Vanguard Total Stock Market Index (NYSE:VTI), which is up 18.7% for the trailing 12-month window. VNQ is a close second-place performer over the past year, posting an 18.5% total return.
A broad-based portfolio of commodities continues to suffer the only loss for the major asset classes for one-year results (252 trading days). But note that a rally in recent weeks has pared the formerly deep one-year decline to a fractional 0.5% slide for iShares S&P GSCI Commodity-Indexed Trust (NYSE:GSG) at Friday’s close vs. the year-ago level.
GMI.F continues to post a strong gain for the one-year window: 14.2% in total-return terms.


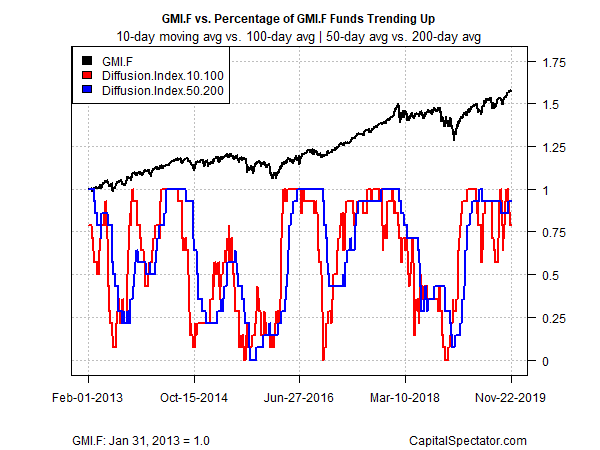
Profiling all the ETFs listed above through a momentum lens continues to show an upside bias overall. The analysis is based on two sets of moving averages. The first compares the 10-day moving average with its 100-day counterpart — a proxy for short-term trending behavior (red line in chart below). A second set of moving averages (50 and 200 days) represent the intermediate measure of the trend (blue line). At last week’s close, most markets remain in a bullish posture.
