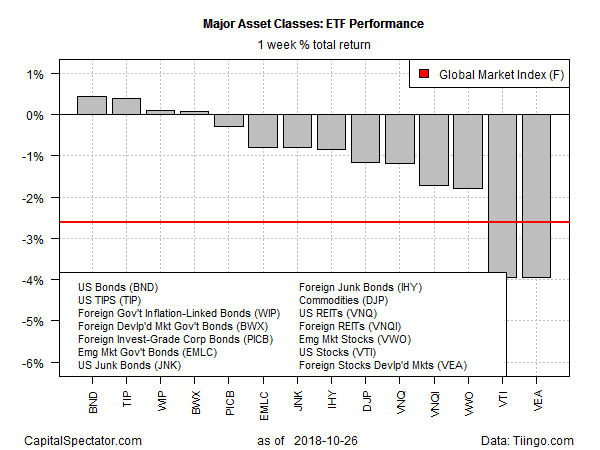
A rush into safe-haven US Treasuries dominated last week’s trading action for winners amid a rout in equity markets around the world, based on profiling the major asset classes via a set of exchange-traded products.
Investment-grade US fixed-income topped the leaderboard last week: Vanguard Total Bond Market (BND) added 0.4% over the five trading days through Oct. 26. The gain lifted the ETF to its highest close since Oct. 2.
Stocks in US and foreign equities in developed markets were tied for last week’s biggest setback. Vanguard Total Stock Market (VTI) and Vanguard FTSE Developed Markets (VEA) each lost a hefty 4.0% in the last full week of trading for October. The selling wave left VTI at its lowest close since May while VEA tumbled to a one-and-a-half-year low on Friday.
The bulls are hoping that stock buybacks will provide some support to the battered US equity market in the coming weeks. But Mark Mobius, a veteran fund manager, tells Bloomberg that political risk may weigh on US stocks if the Democrats retake the House in next week’s election. Meanwhile, there’s “a lot of value” in developing-market stocks courtesy of sharp declines in recent months, added the co-founder of Mobius Capital Partners LLP.
Meanwhile, an ETF-based version of the Global Markets Index (GMI.F) continued to slide last week. This investable, unmanaged benchmark that holds all the major asset classes in market-value weights fell for a fifth straight week, tumbling 2.6%.

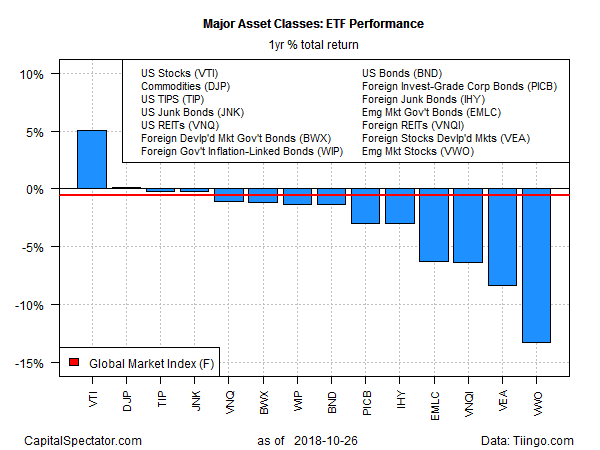
Turning to the one-year trend, most of the major asset classes are now under water. The main exception: US stocks. Although VTI’s one-year return has been substantially pared in recent weeks, the ETF’s current 5.1% total return for the trailing 12-month period is an outlier on the upside vs. the rest of the field.
The biggest one-year loss at the moment for the major asset classes can be found in emerging-market equities. Vanguard FTSE Emerging Markets (VWO) is in the red with a 13.3% loss.
Last week’s selling pushed GMI.F into negative terrain for the year-over-year change. The benchmark was down 2.6% at Friday’s close vs. the year-ago price after factoring in distributions. The year-over-year decline marks GMI.F’s first negative annual comparison in more than two years.

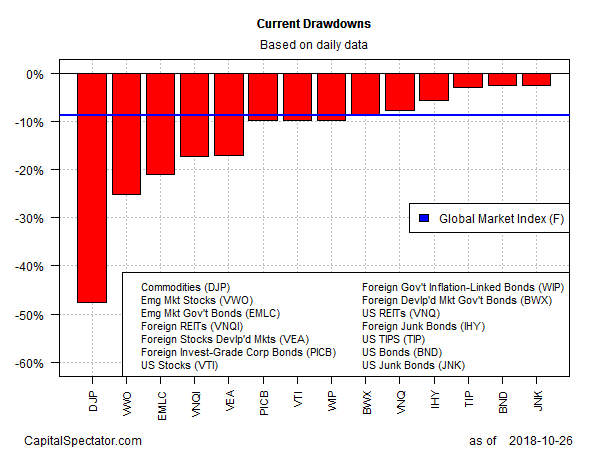
For current drawdown, broadly defined commodities are still posting the biggest decline from the previous peak. The iPath Bloomberg Commodity (DJP) is suffering from a near-50% drawdown. Meantime, US junk bonds are posting the smallest drawdown for the major asset classes – roughly 2.5%, based on SPDR Bloomberg Barclays High Yield Bond (JNK).
GMI.F’s current drawdown is considerably steeper at -8.7% as of last week’s close.

