Bond investors are typically believed to be more sophisticated, which largely explains the yield curve's near perfect history of recession predictions. This explains why many analysts have commented on the narrowing of the yield curve over the first half of this year.
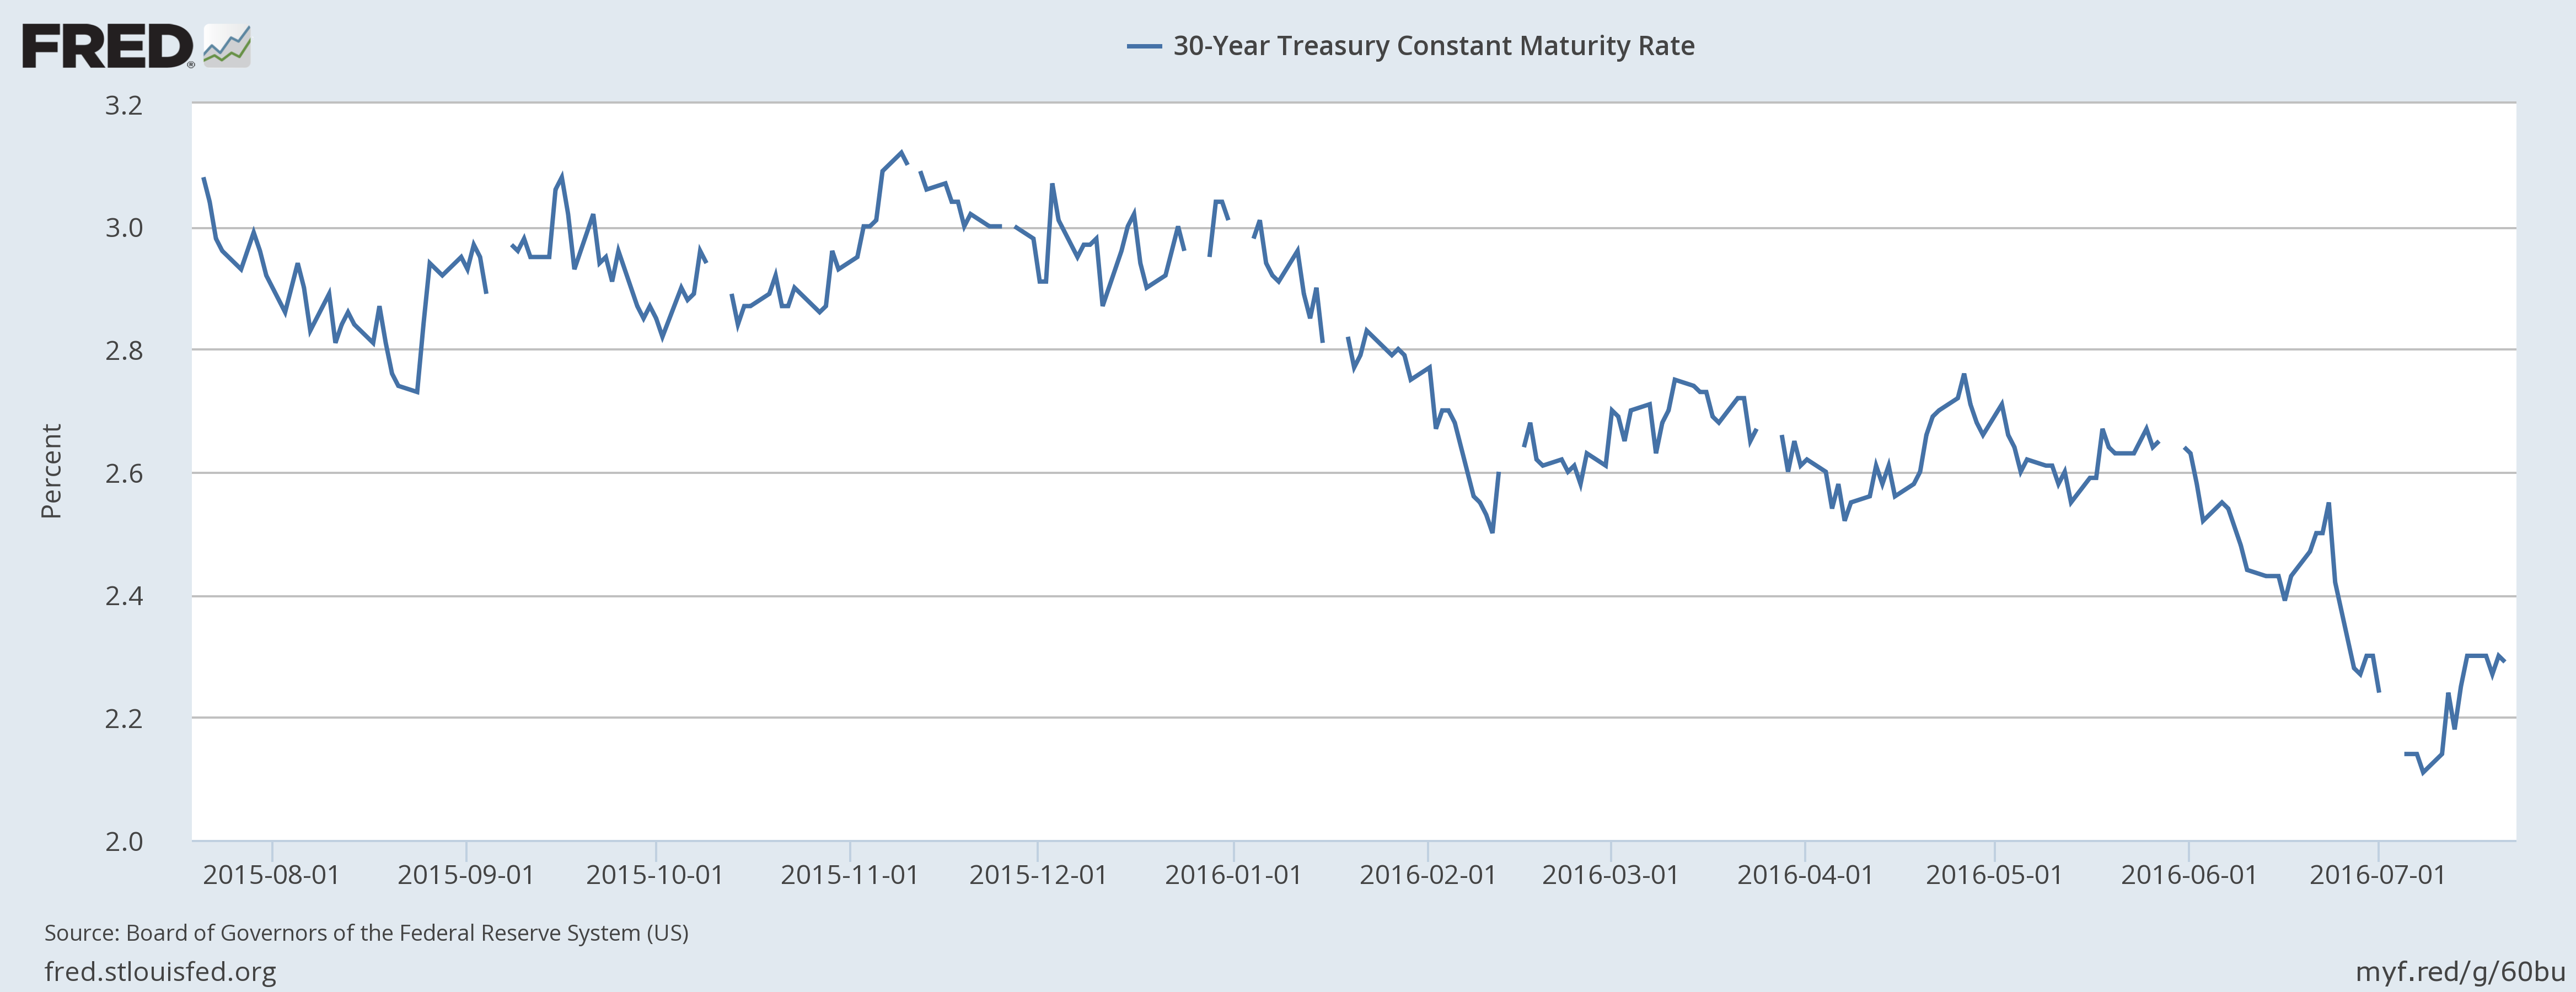
The severity of the decline in the long-end is especially pronounced; below is a 1-year chart of the 30-year CMT to illustrate the drop:

The yield traded between 2.8% and 3.1% until the first of the year. Then prices rallied in reaction to a weak 1Q GDP print, sending yields to lower levels. The 30-year again traded in a range, this time between 2.5% and 2.75%, until Brexit. Once again bonds rallied, sending yields to as low as 2.11. From peak-to-trough, the 30-year yield has declined as much as 70 basis points.
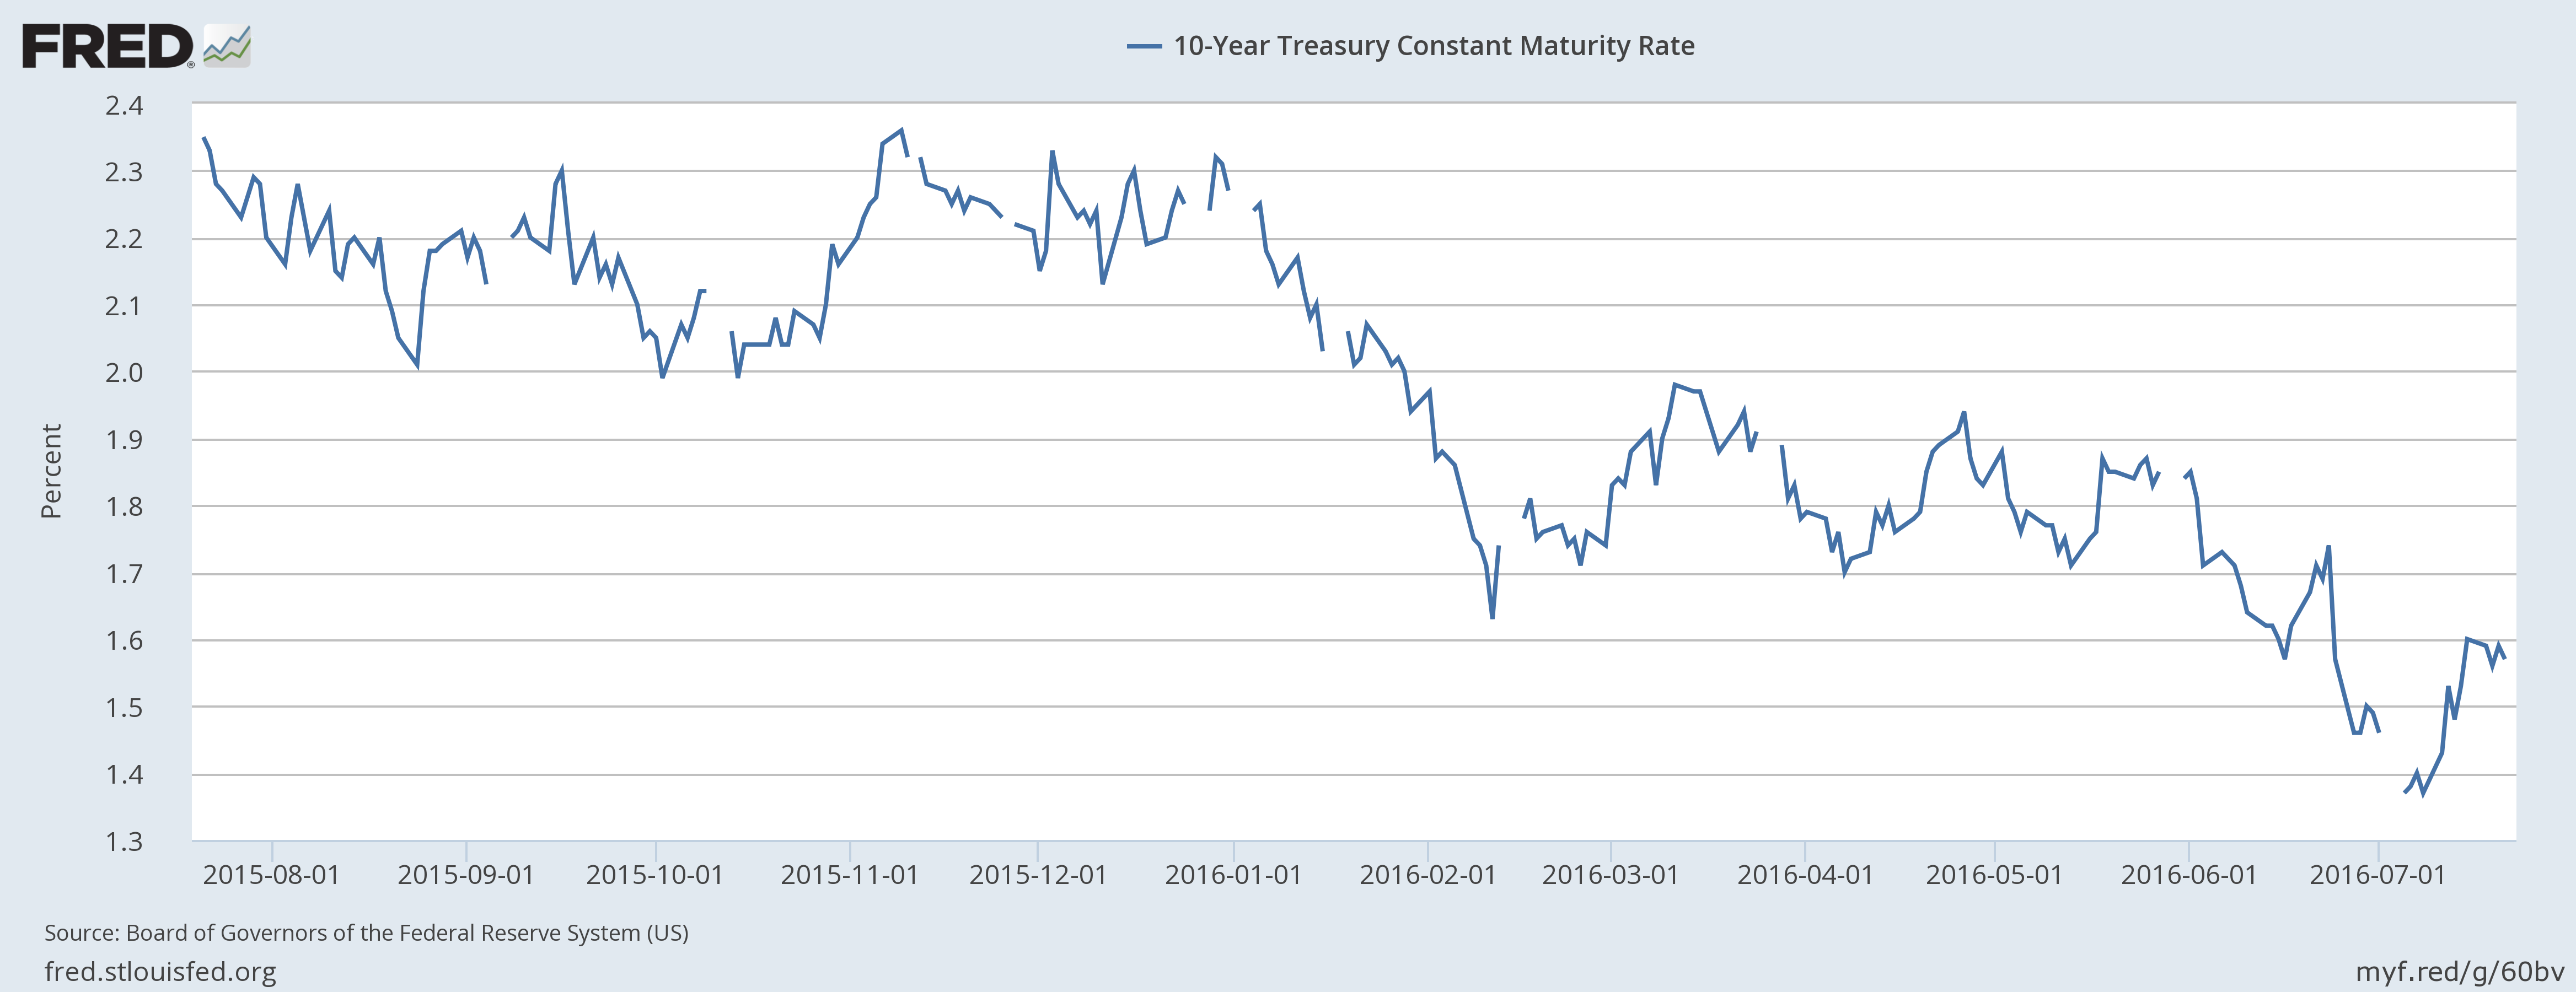
Next, let’s look at the 10-year:

Above we see three different trading ranges: 2%-2.4% until January, 1.6%-2.75% until early July and then another rally, when yields went as low as 1.37%. From peak-to-trough, the 10-year has declined as much as 60 basis points.
There are no bullish reasons for this development. Investors see little to no inflation, which implies they see middling growth at best.
