This week was loaded with Federal Reserve speeches, media appearances and interviews. But the most important was Janet Yellen, who gave an upbeat presentation of the U.S economy while also clearly supporting an interest rate increase at an upcoming meeting, barring some type of negative economic shock.
Her comments highlighted the following economic data points:
Employment
Job gains averaged 180,000 per month from January through October, a somewhat slower pace than last year but still well above estimates of the pace necessary to absorb new entrants to the labor force. The unemployment rate, which stood at 4.9 percent in October, has held relatively steady since the beginning of the year. The stability of the unemployment rate, combined with above-trend job growth, suggests that the U.S. economy has had a bit more "room to run" than anticipated earlier. This favorable outcome has been reflected in the labor force participation rate, which has been about unchanged this year, on net, despite an underlying downward trend stemming from the aging of the U.S. population.
The following charts clarify the points made above:
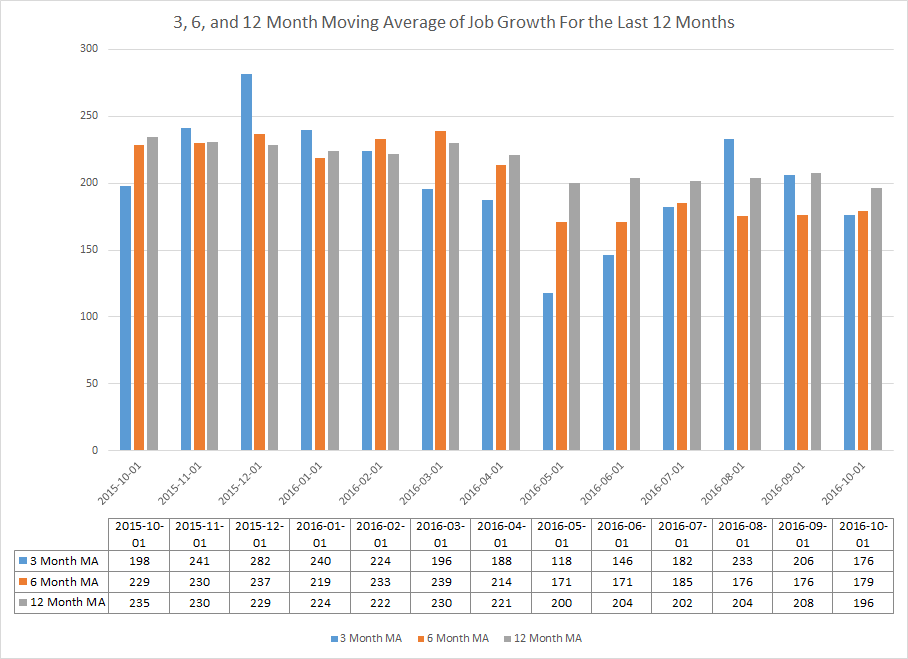
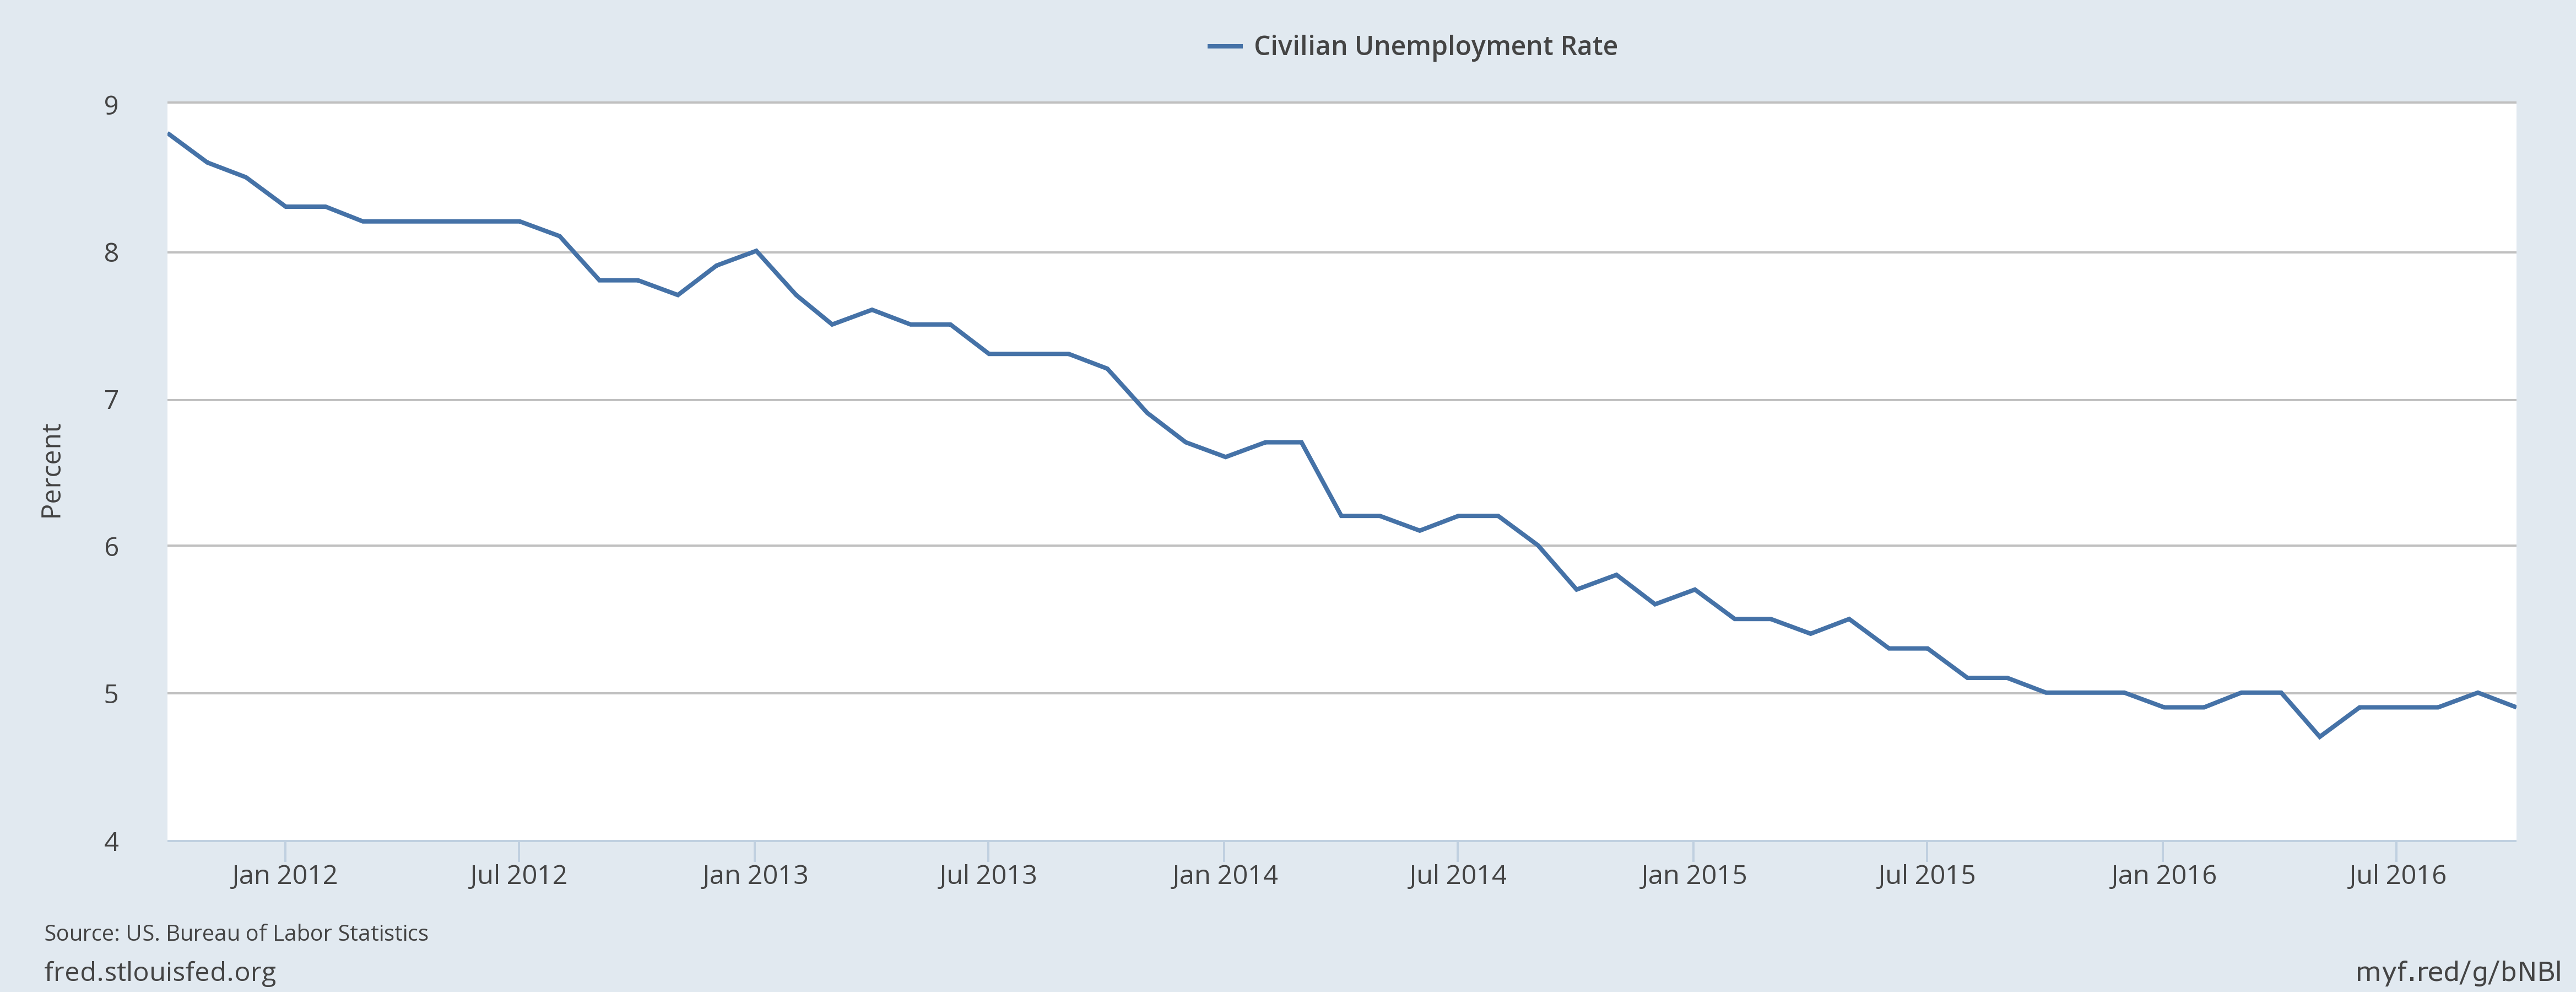
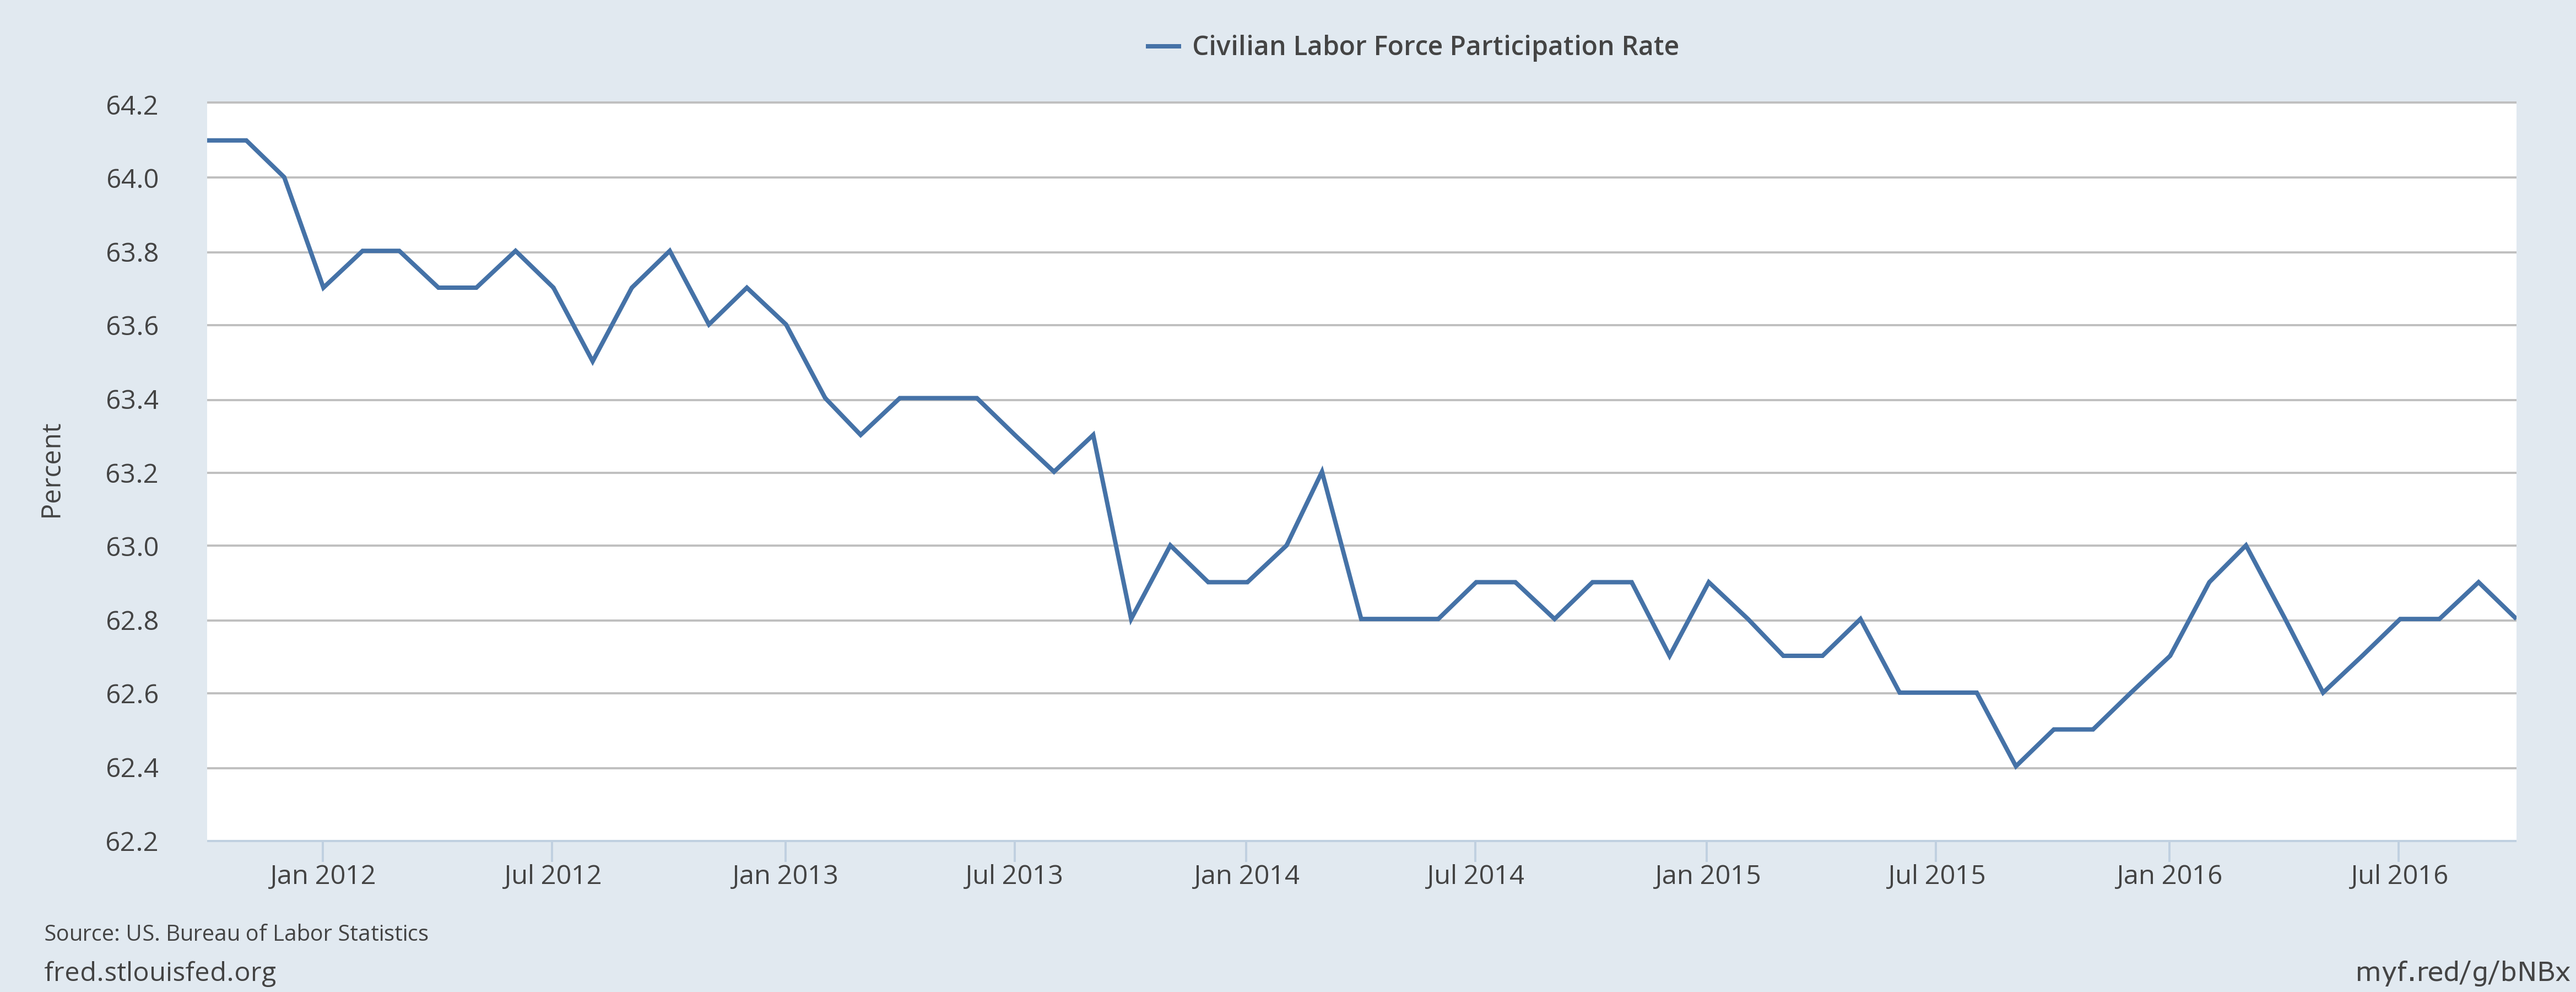
The top chart shows the 3, 6, and 12 month moving averages of employment gains for the last year. With the exception of 3-month averages dip in March and April, all three have been above 150,000, which means job growth is sufficient to absorb population growth. The middle chart shows the unemployment rate, which has been slightly below 5% for the better part of 2016. The bottom chart shows the labor force participation rate, which, like the unemployment rate, has moved sideways since January. All three charts show a strong job market.
Consumer spending has continued to post moderate gains, supported by solid growth in real disposable income, upbeat consumer confidence, low borrowing rates, and the ongoing effects of earlier increases in household wealth
The following two chart clarify the points made above:
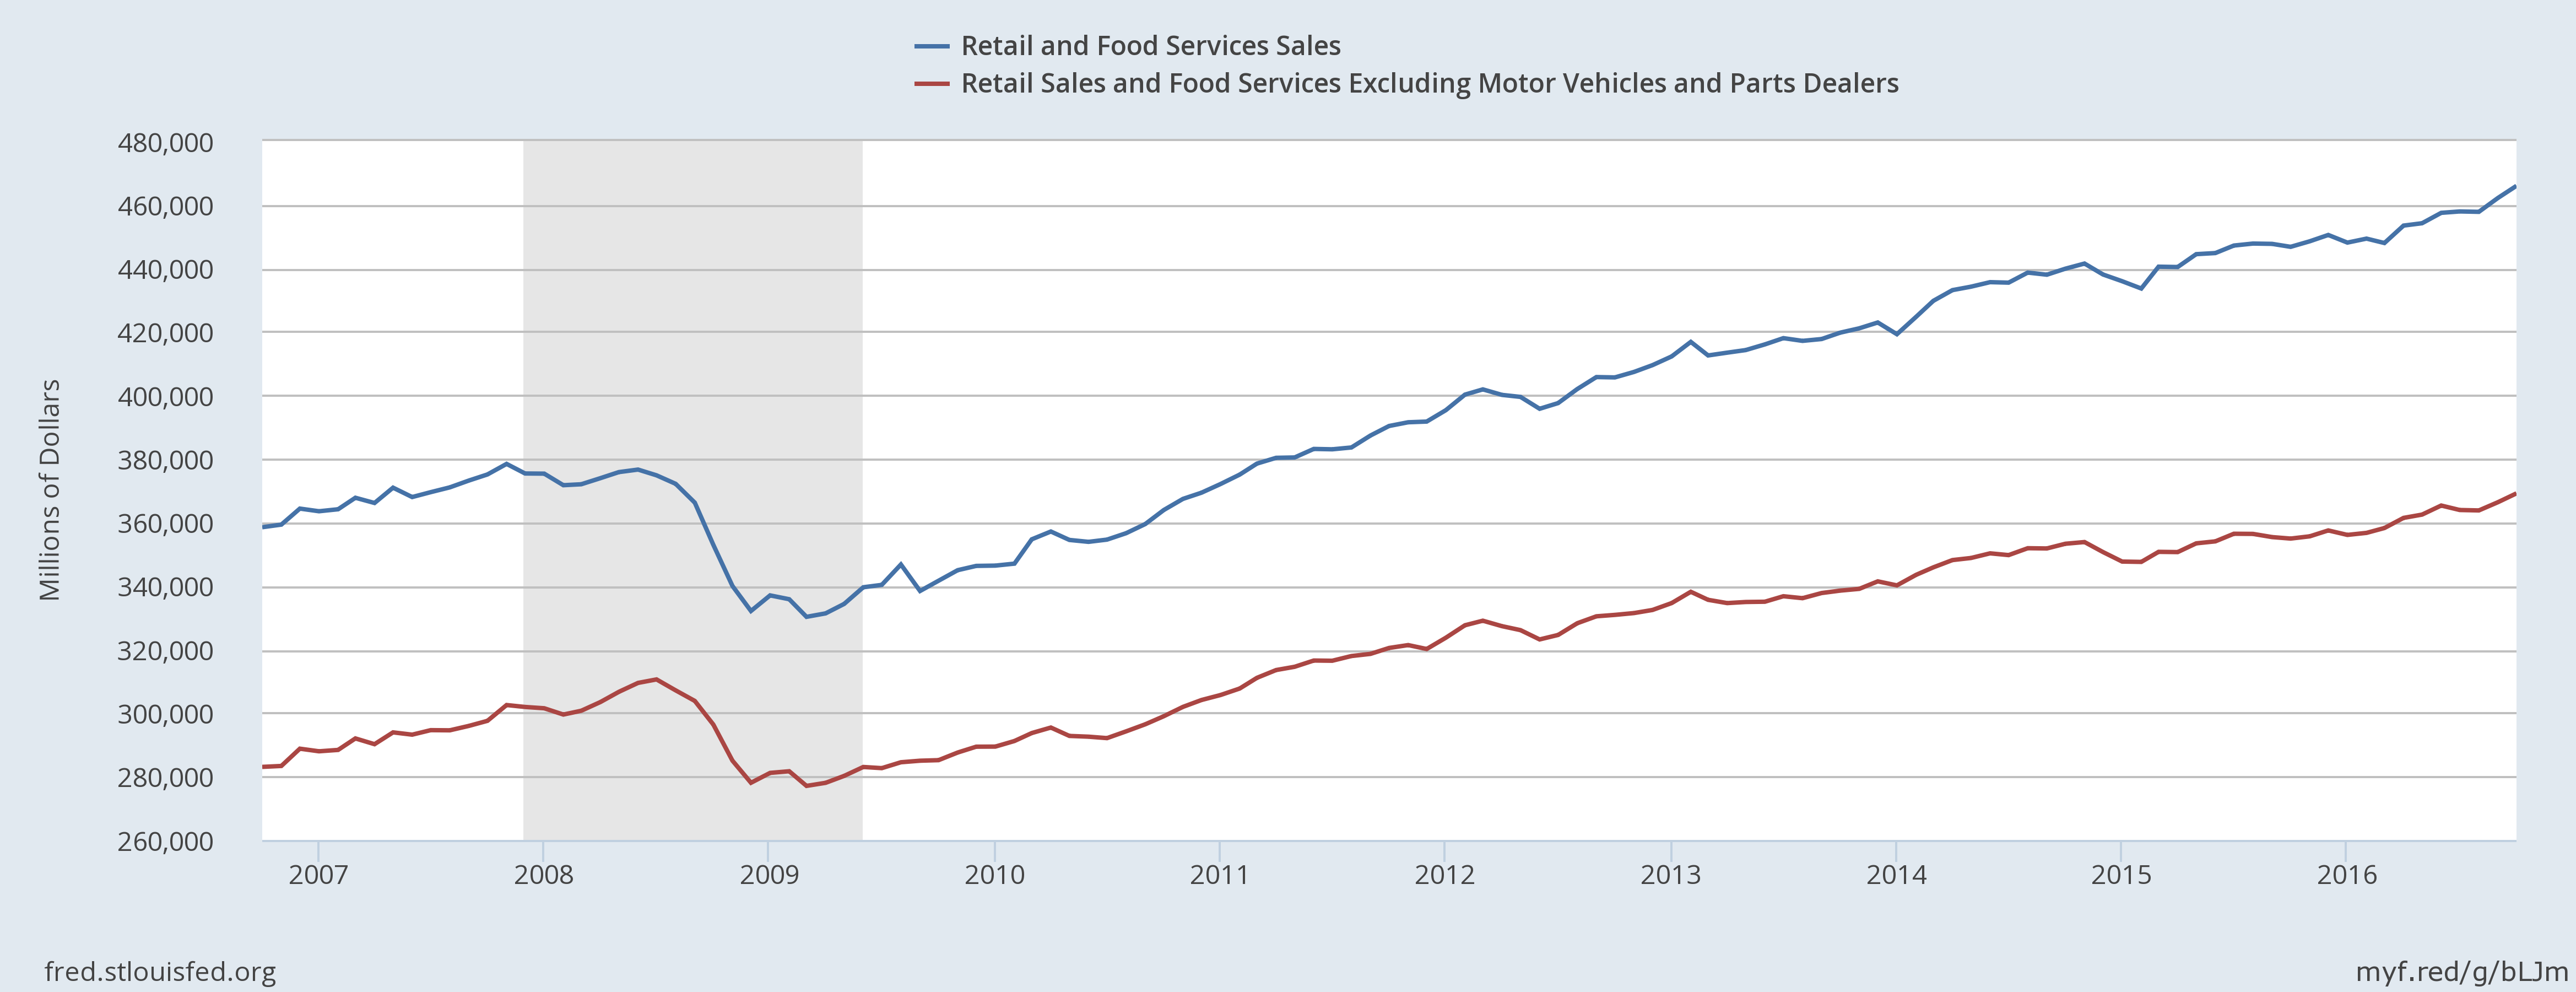
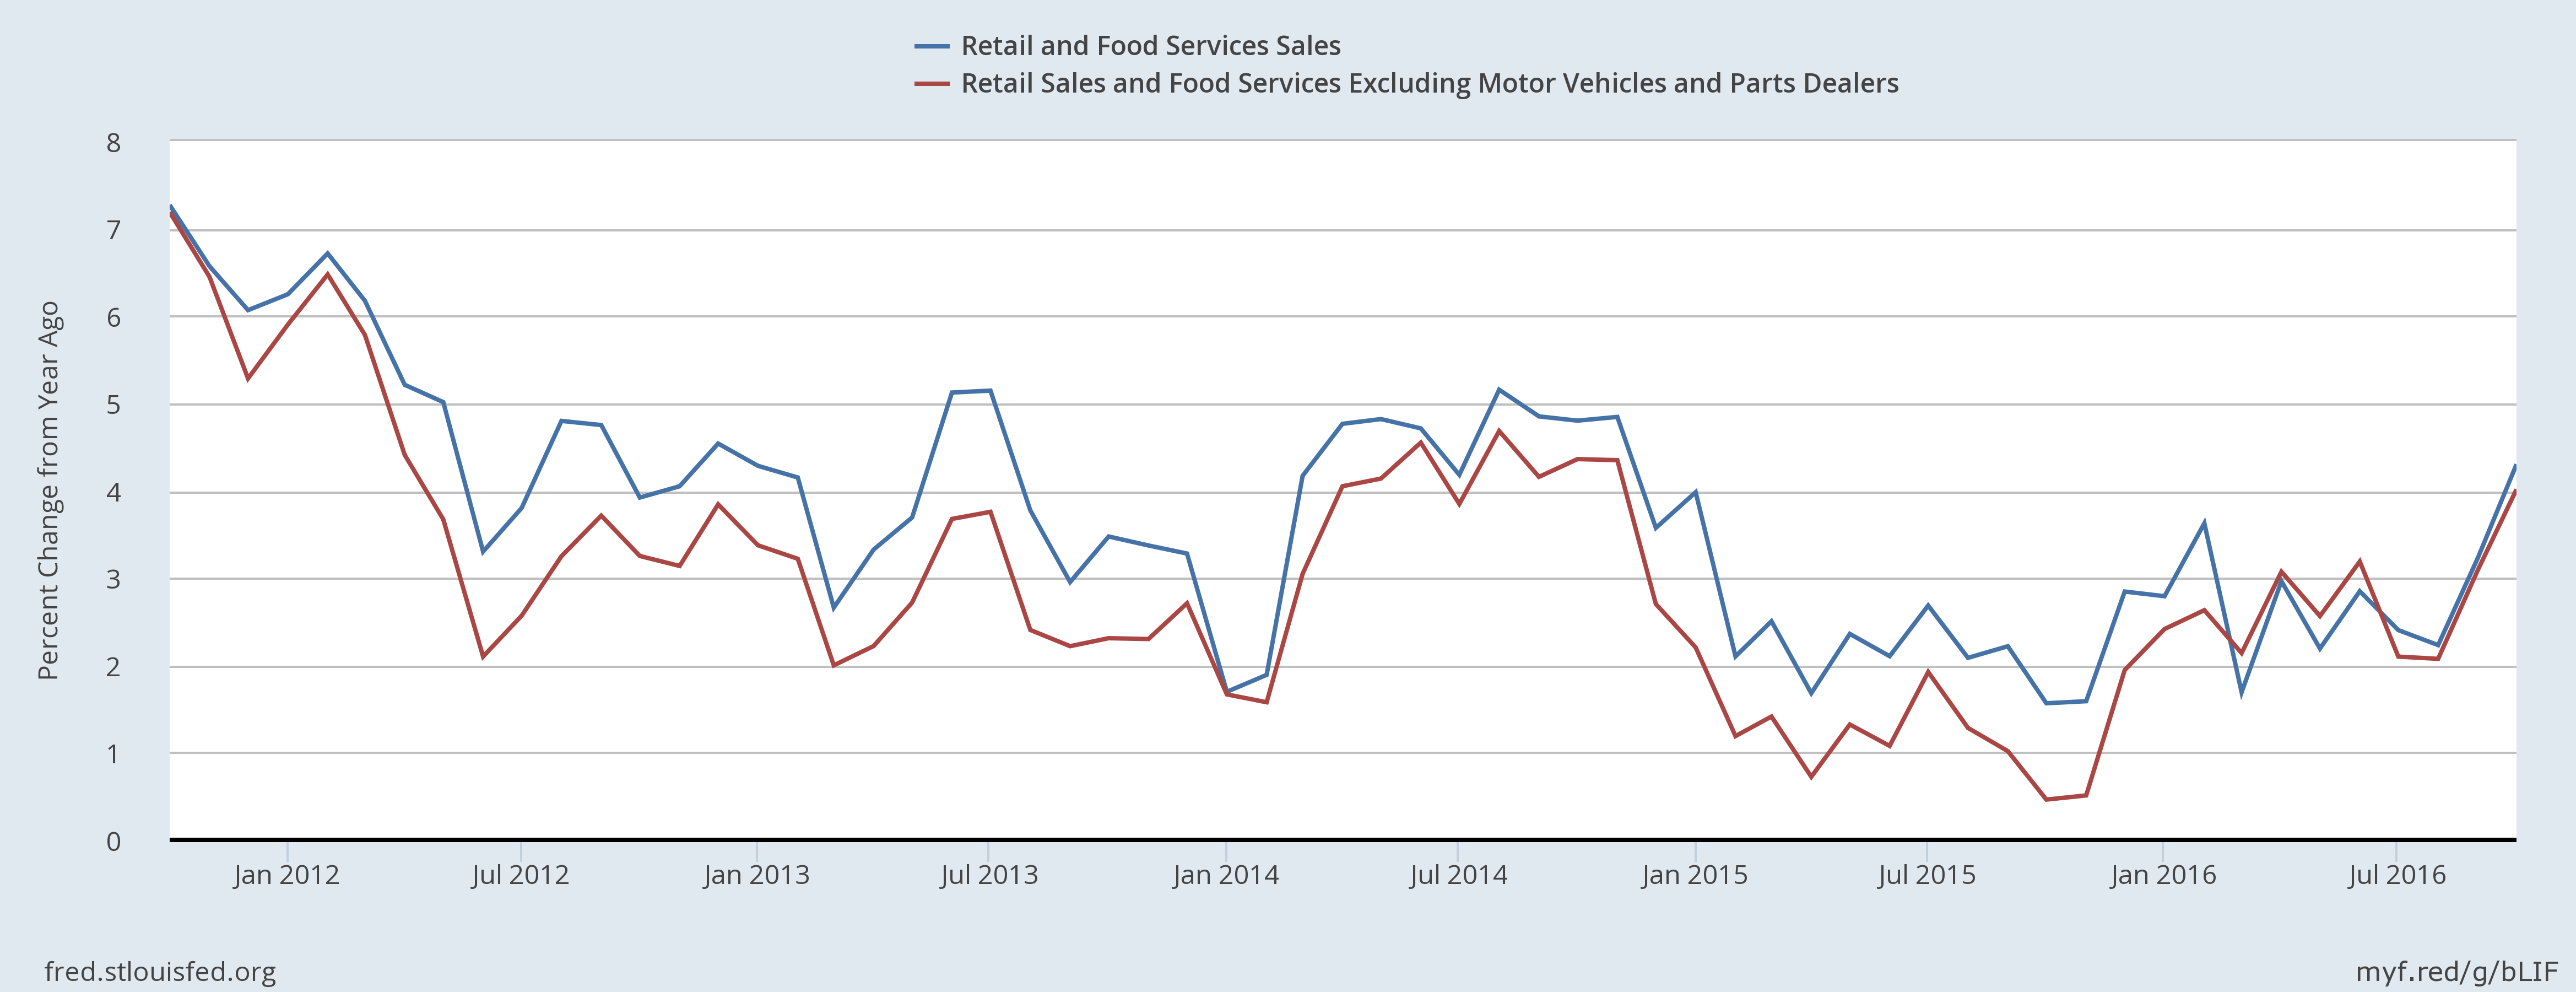
Both use the same data: real retail sales and real retail sales less autos. The top chart shows the absolute value while the bottom chart shows the Y/Y percentage change. The top chart is a continuous uptrend while the bottom chart shows a recent sharp increase. Both show a strong retail sector.
Business Investment:
By contrast, business investment has remained relatively soft, in part because of the drag on outlays for drilling and mining structures that has resulted from earlier declines in oil prices.
The following three charts clarify the points made above:
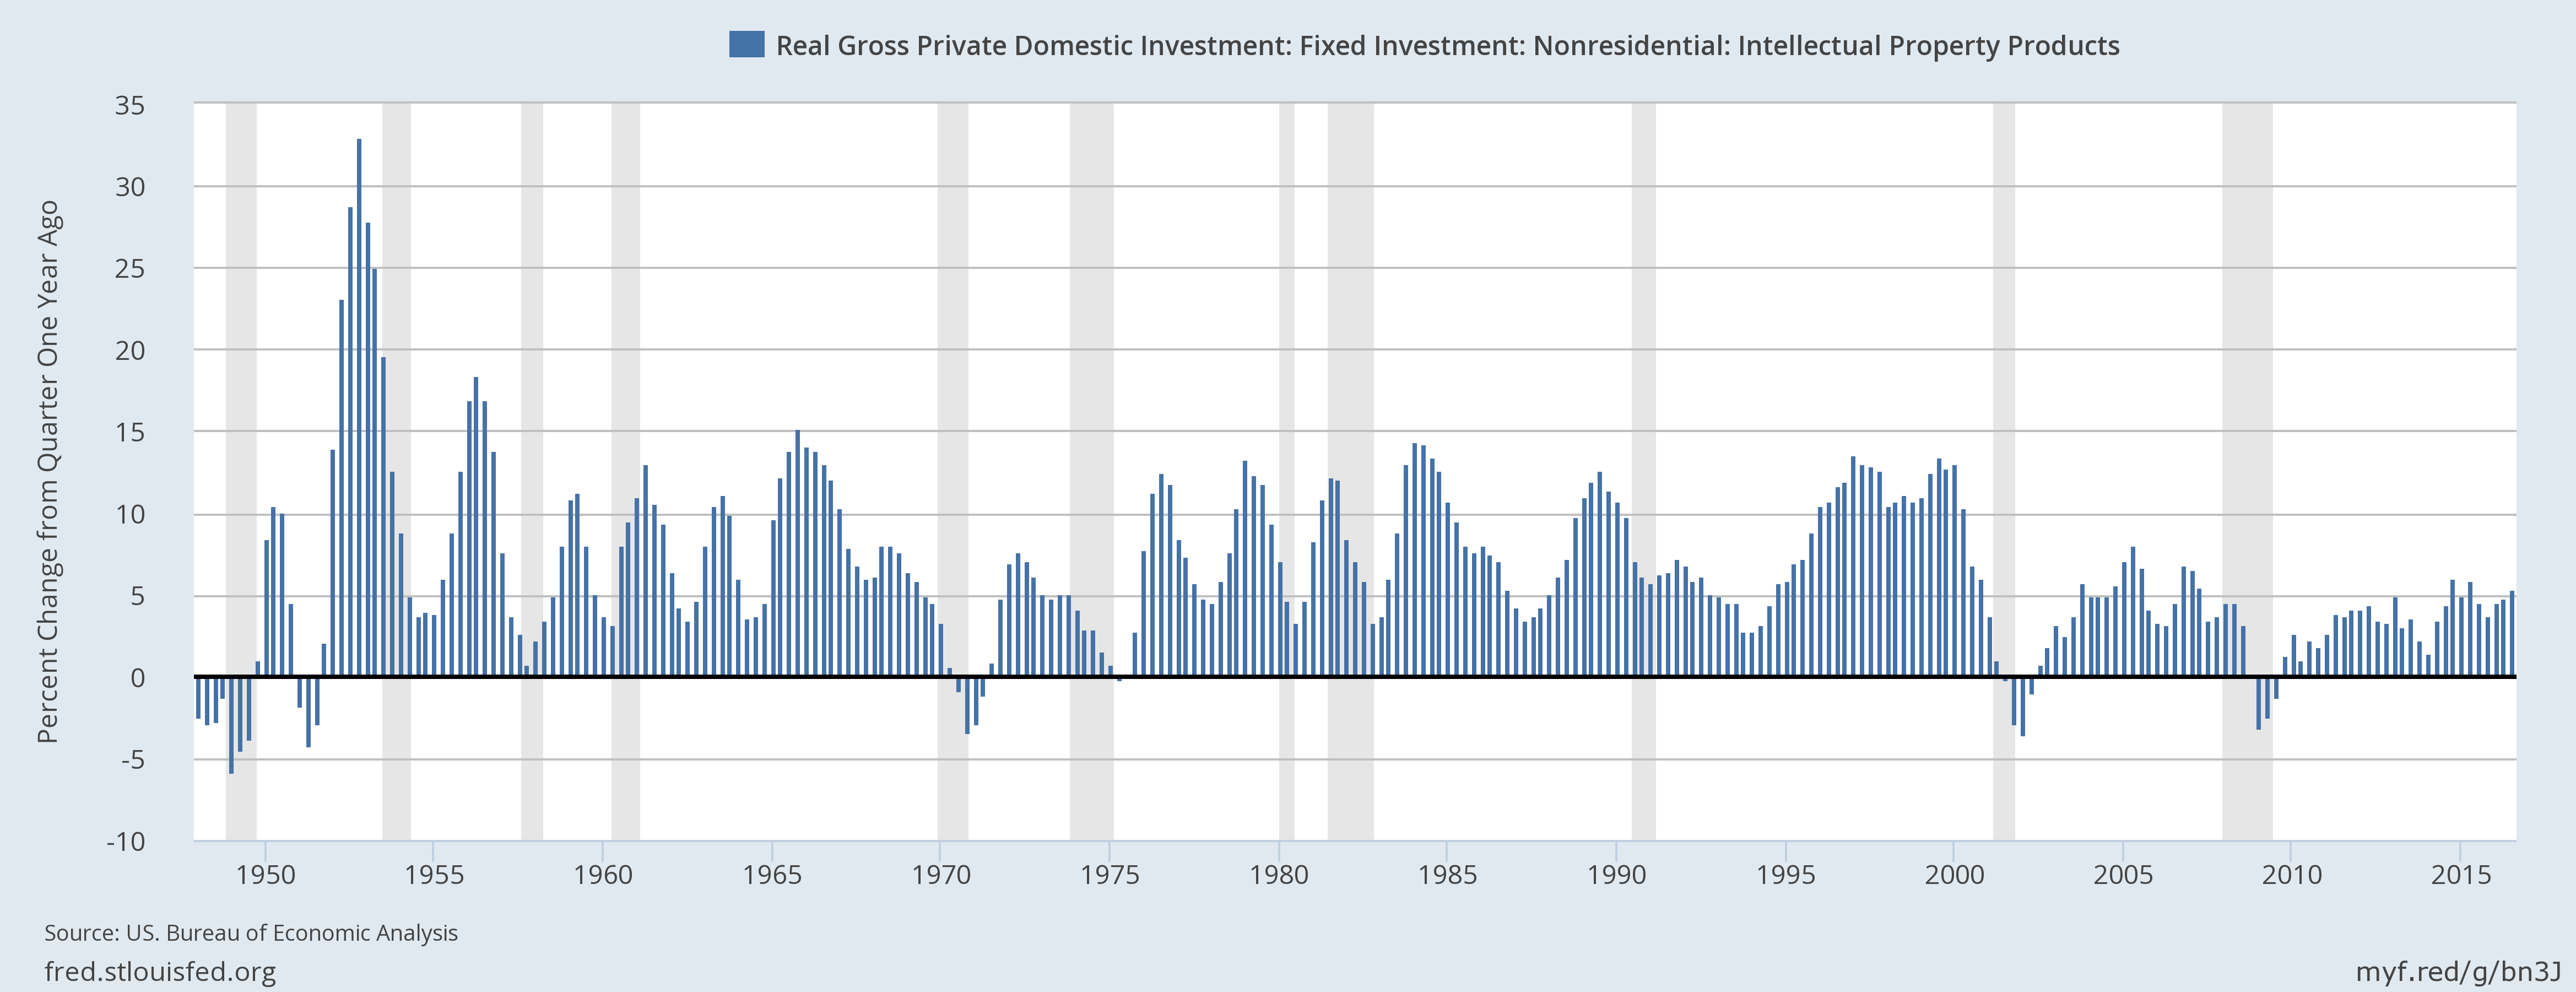
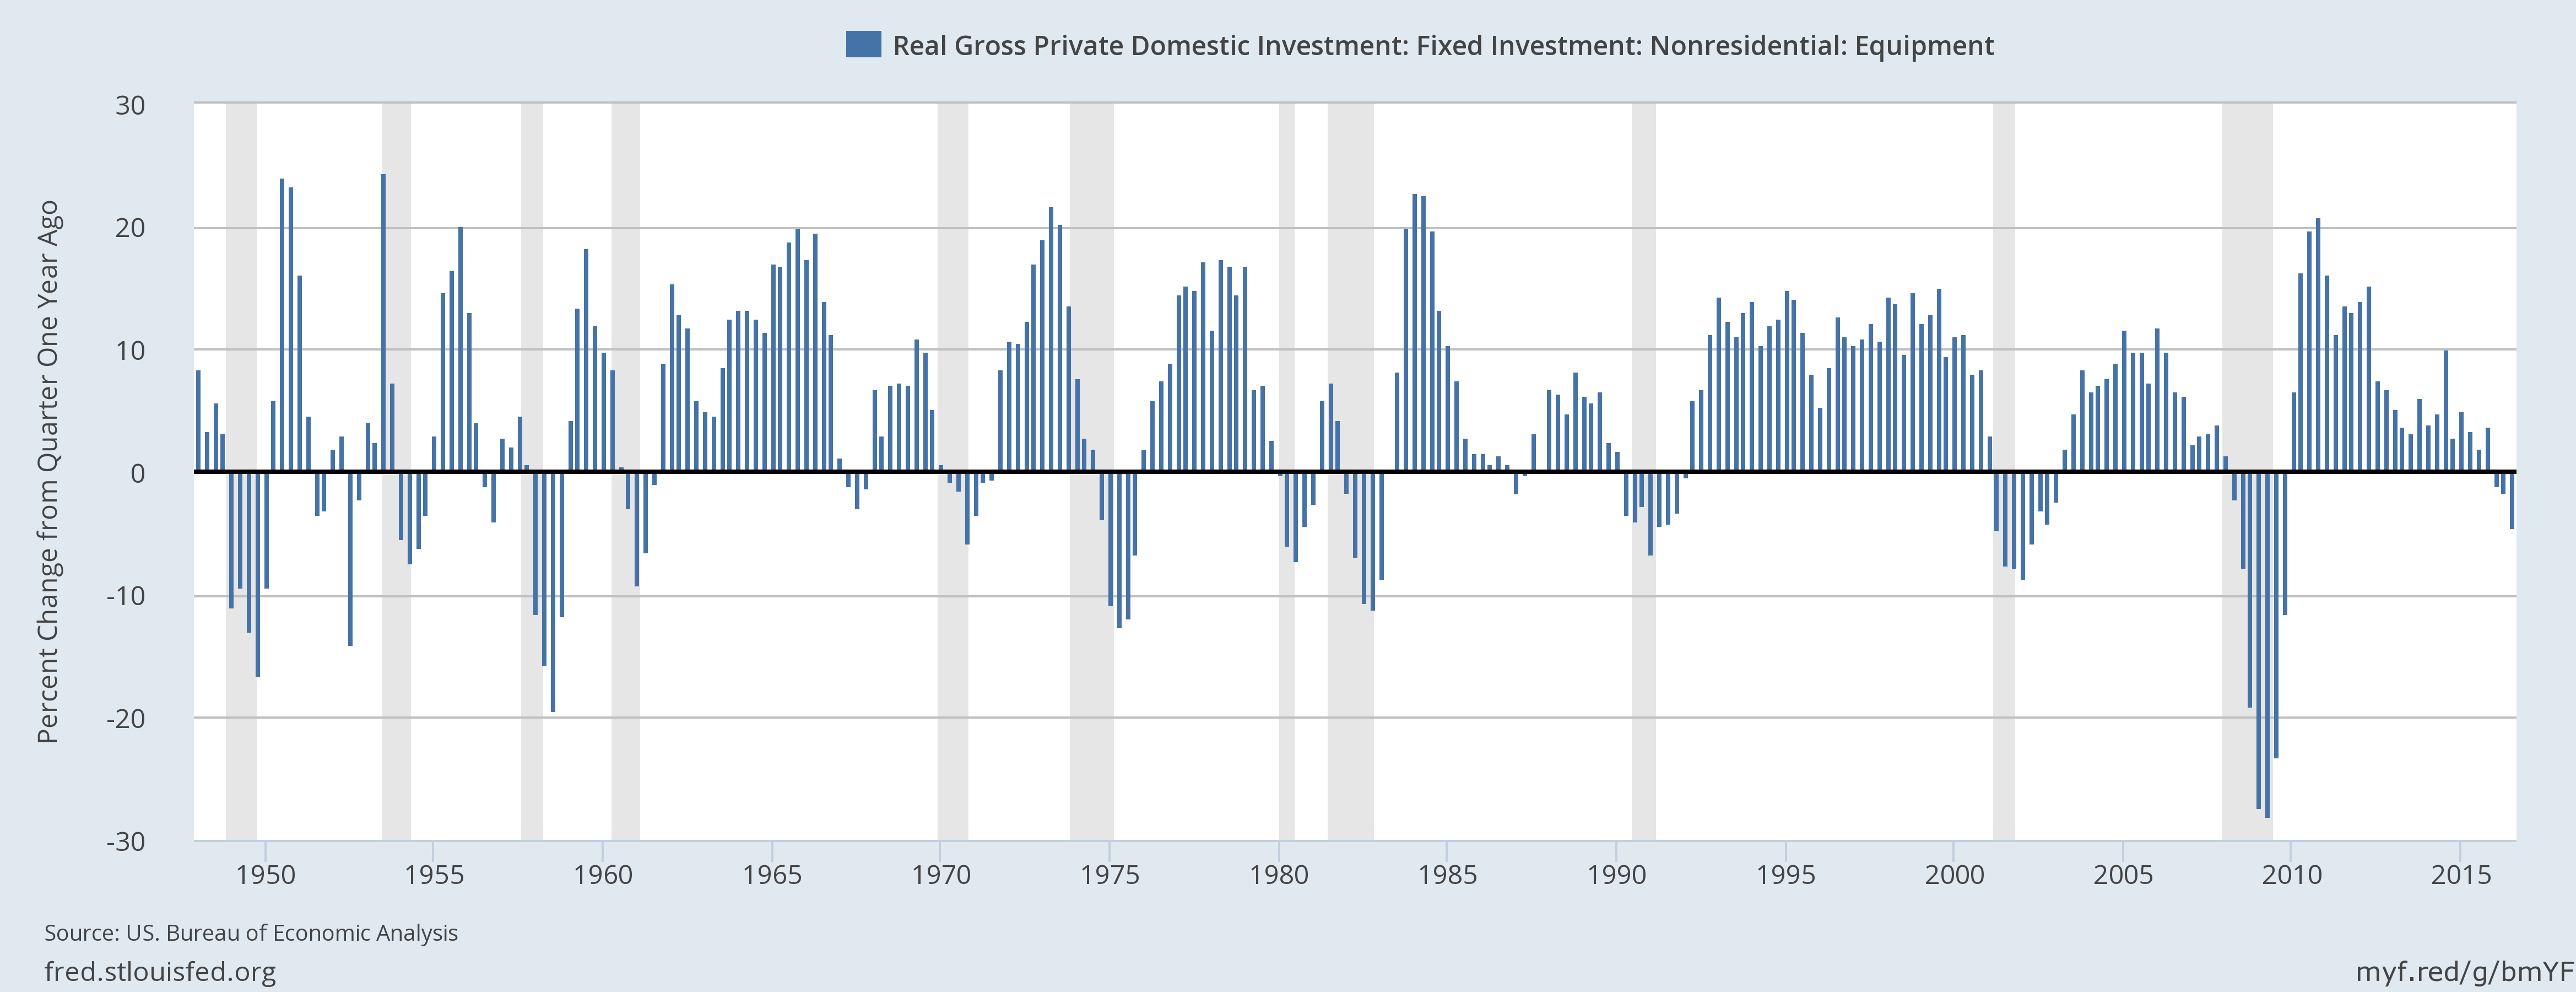
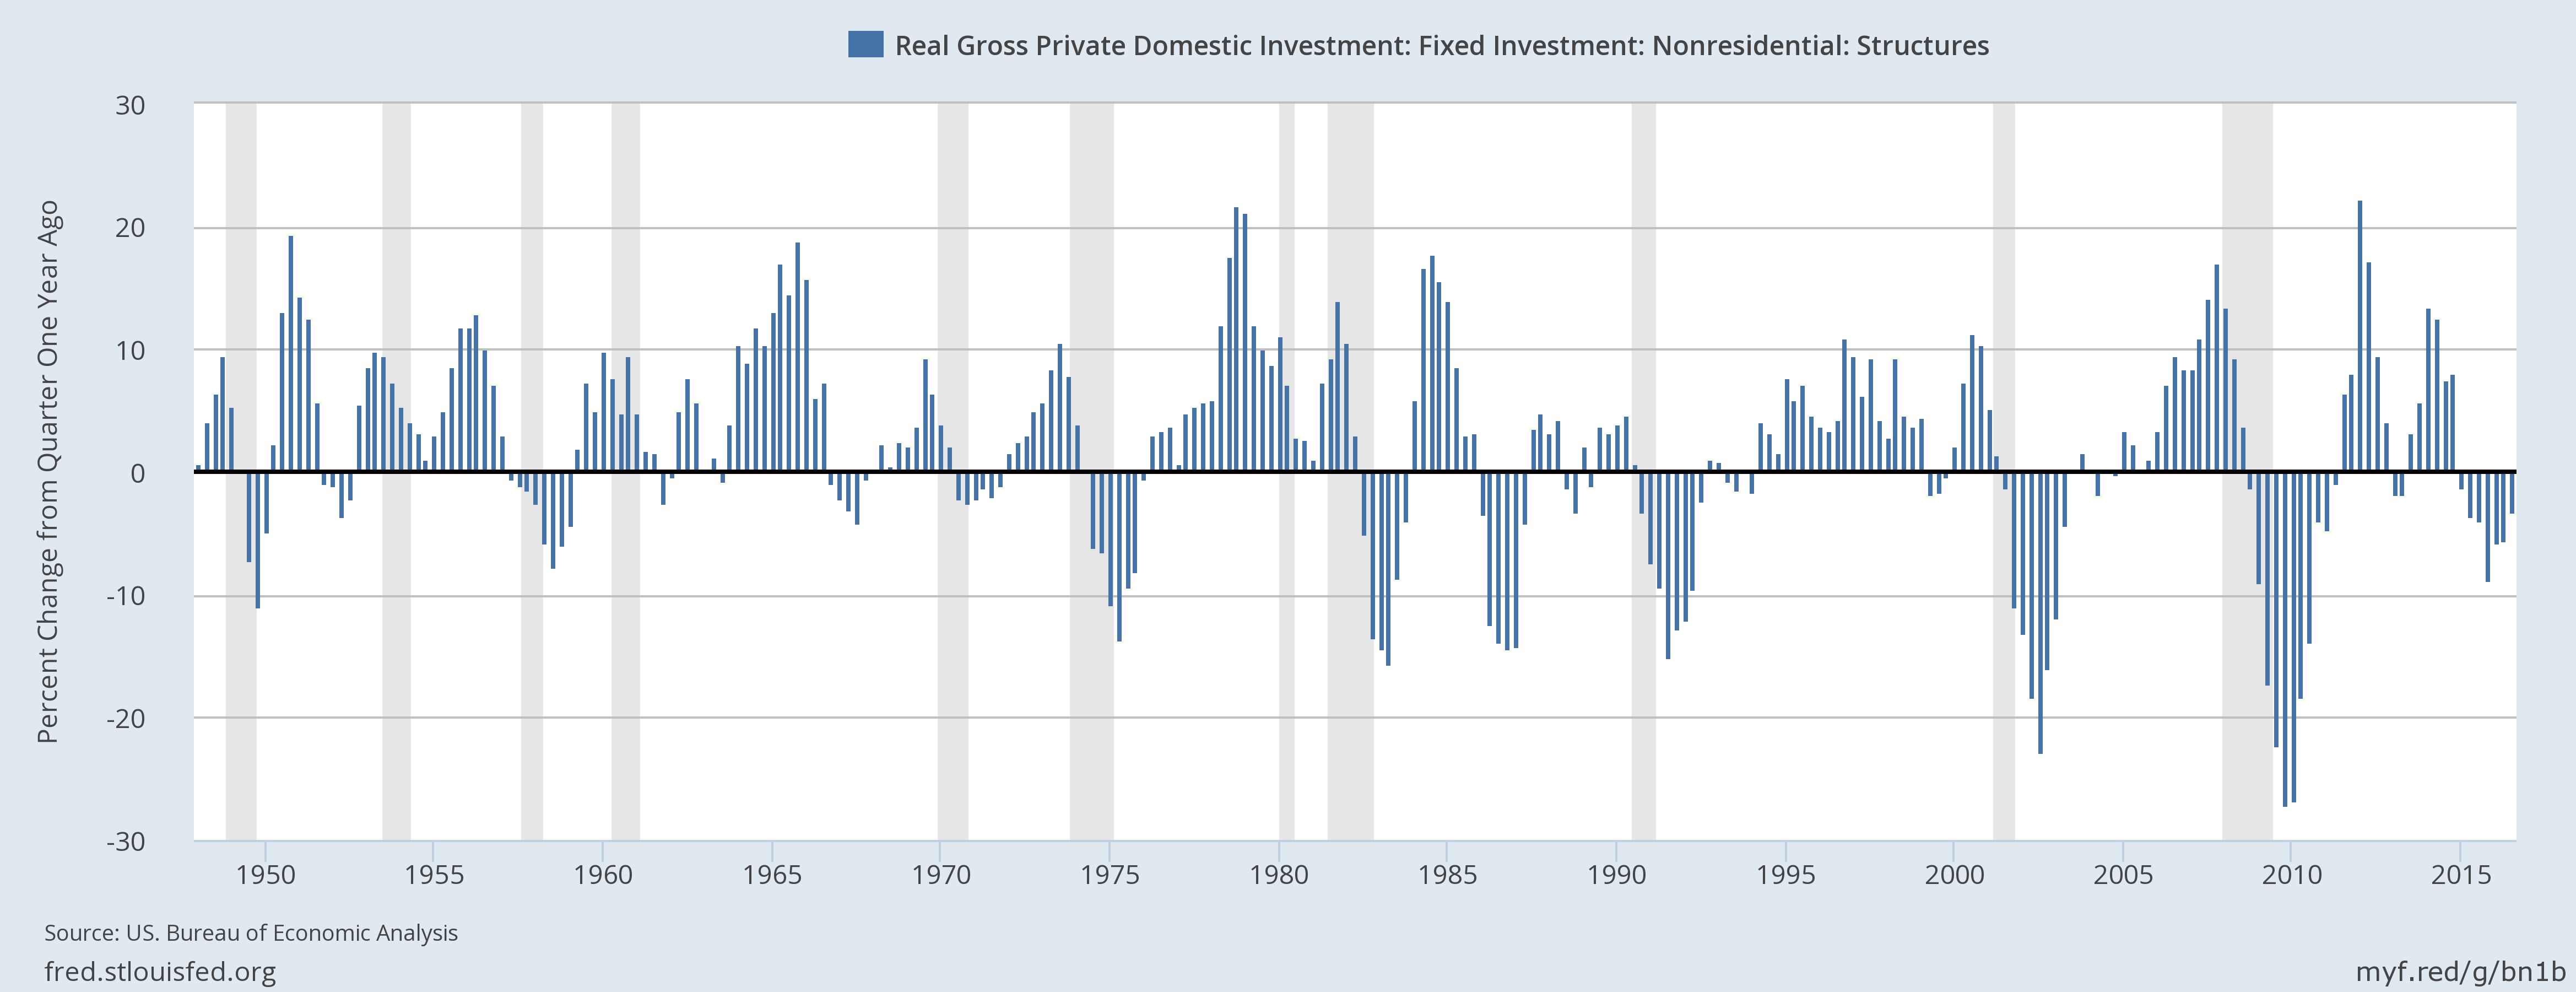
The top chart shows intellectual property investment, which has been consistent since the end of the recession. But note that it remains at levels seen in the last recession, which is far below that of the late 1990s economic boom. The middle chart shows equipment spending, which peaked after the end of the recession but has continued to move lower. The bottom chart shows non-residential investment, which has contracted for the last 7 quarters.
Prices:
Turning to inflation, overall consumer prices, as measured by the price index for personal consumption expenditures, increased 1-1/4 percent over the 12 months ending in September, a somewhat higher pace than earlier this year but still below the FOMC's 2 percent objective. Much of this shortfall continues to reflect earlier declines in energy prices and in prices of non-energy imports. Core inflation, which excludes the more volatile energy and food prices and tends to be a better indicator of future overall inflation, has been running closer to 1-3/4 percent.
The following chart is from Federal Reserve President Bullard’s speech this week:
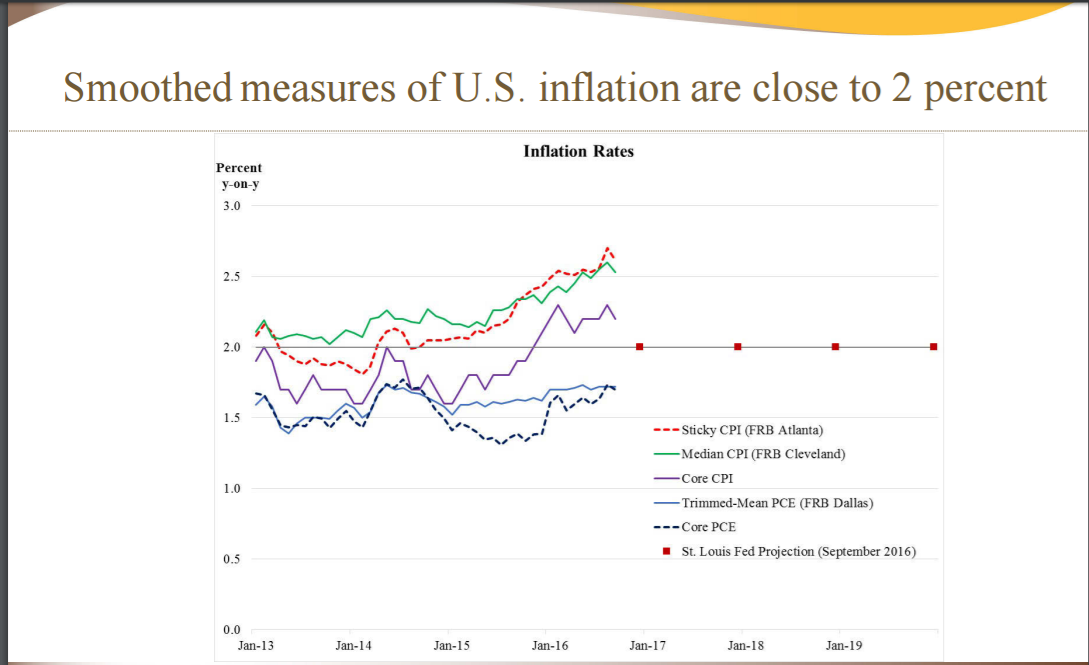
Various inflation measures are below and above the 2% level.
No Fed governor will come out and specifically state when a rate hike is coming. But the emboldened comments below strongly imply December is in play:
At our meeting earlier this month, the Committee judged that the case for an increase in the target range had continued to strengthen and that such an increase could well become appropriate relatively soon if incoming data provide some further evidence of continued progress toward the Committee's objectives. This judgement recognized that progress in the labor market has continued and that economic activity has picked up from the modest pace seen in the first half of this year. And inflation, while still below the Committee's 2 percent objective, has increased somewhat since earlier this year. Furthermore, the Committee judged that near-term risks to the outlook were roughly balanced.
Waiting for further evidence does not reflect a lack of confidence in the economy. Rather, with the unemployment rate remaining steady this year despite above-trend job gains, and with inflation continuing to run below its target, the Committee judged that there was somewhat more room for the labor market to improve on a sustainable basis than the Committee had anticipated at the beginning of the year. Nonetheless, the Committee must remain forward looking in setting monetary policy. Were the FOMC to delay increases in the federal funds rate for too long, it could end up having to tighten policy relatively abruptly to keep the economy from significantly overshooting both of the Committee's longer-run policy goals. Moreover, holding the federal funds rate at its current level for too long could also encourage excessive risk-taking and ultimately undermine financial stability.
Again, a rate hike is not guaranteed, but certainly a high probability at the next meeting.
