This article should be read in conjunction with this weekly equity market review.
A rate hike of at least 25 basis points was a done deal a few months ago. But recent global and domestic events have greatly lowered that possibility. It began with the Chinese equity sell-off followed by the surprise yuan devaluation. Recent Chinese manufacturing weakness adds to the mix. Although some recent US news has been positive, continued price weakness, lower industrial production and a recent employment slowdown show the US is not immune to the slowing international environment. At this point, there are few fundamental reason to raise rates, leaving the only motivation being the Fed’s desire to begin the process of normalization.
Prices are a non-issue. From the Atlanta Fed:
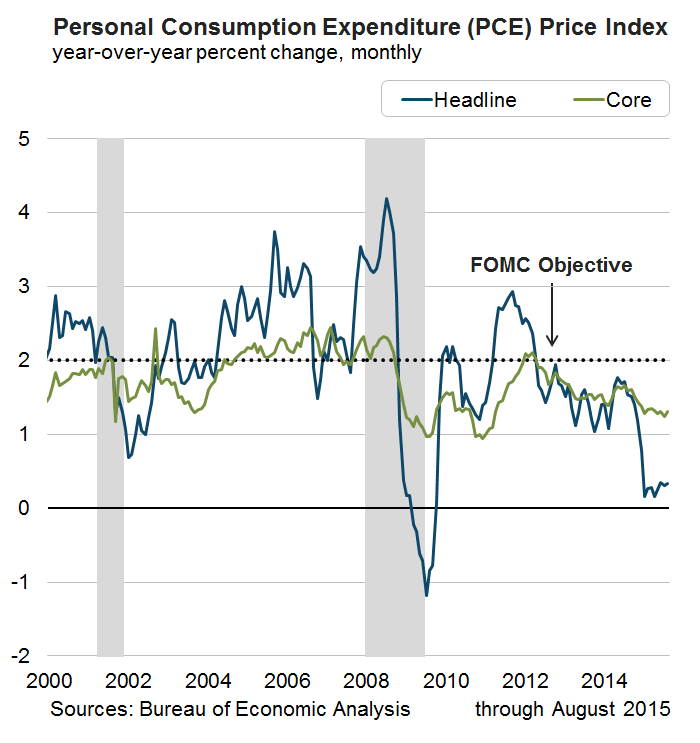
The headline personal consumption expenditure (PCE) price index rose 0.3 percent year over year in August, matching the increases in June and July. The core PCE price index, which excludes food and energy, rose 1.3 percent year over year in August, up from 1.2 percent in July. At a one-month annualized rate, the headline PCE price index rose 0.04 percent in August, down from 1.0 percent in July, and the core figure (one-month annualized rate) rose 1.3 percent, up from 0.9 percent in July.
Here is the accompanying chart:
The CPI index shows the same pattern:
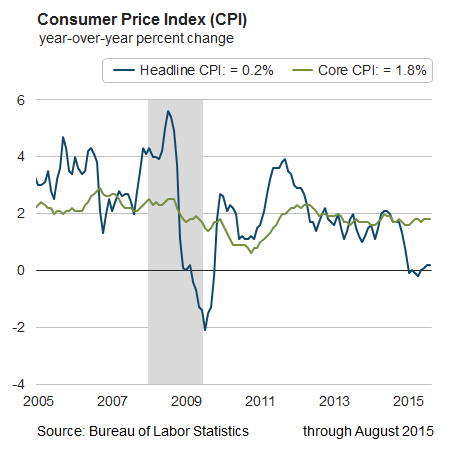
A combination of factors is keeping inflation low. Commodity price inputs are weak, as the “commodity super-cycle” begins winding down. There is little wage pressure and PCEs (which is a good proxy for overall consumer demand) continue growing at a modest pace, but not one to warrant concern about demand-pull inflation. There is no reason for the Fed to be concerned about inflation at this point.
Total establishment jobs printed at 142,000, far below consensus estimates. However, a year-over-year comparison of various job categories explains the weakness. In September of 2014 the economy created 250,000 jobs—108,000 higher than last month. Over the last year, goods producing industries swung from +38,000 to -13,000, for a total loss of 51,000. The sub-categories of mining, construction and manufacturing all declined Y/Y. Oil sector weakness and the negative impact of the strong dollar on exports explain most of these losses (see the anecdotal comments of the latest ISM report for more detail). Service industries declined 66,000 Y/Y, with professional services accounting for 20,000. Again, the oil patch slowdown explains a large percentage of these losses. This back-of-the-envelope calculation shows the oil sector and strong dollar are probably responsible for approximately 65% of the jobs market slowdown.
Fed Chair Yellen has mentioned in numerous presentations she favors looking at a variety of labor market indicators. The Atlanta Fed’s Spider Chart puts a large number of indicators into a wider focus:
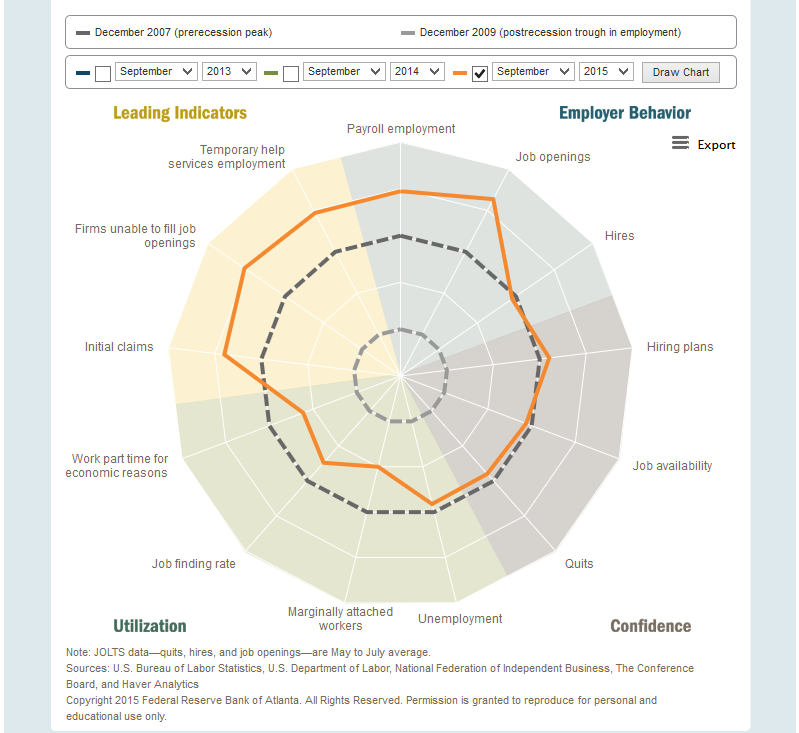
The inner gray circle is the 2007 trough; clearly, things are better. And most leading indicators and measures of employer behavior (ten to one o’clock on the graph) are doing well relative to their 2009 highs. On the negative side is employee/job seeker confidence (as measured by job availability and quits at 4 and 5 o’clock), which is still a bit low. Utilization (five to eight o’clock) is the big problem. This is best shown in the U-6 chart, which shows the combined percentage of unemployed, people marginally attached and those working part-time for economic reasons:
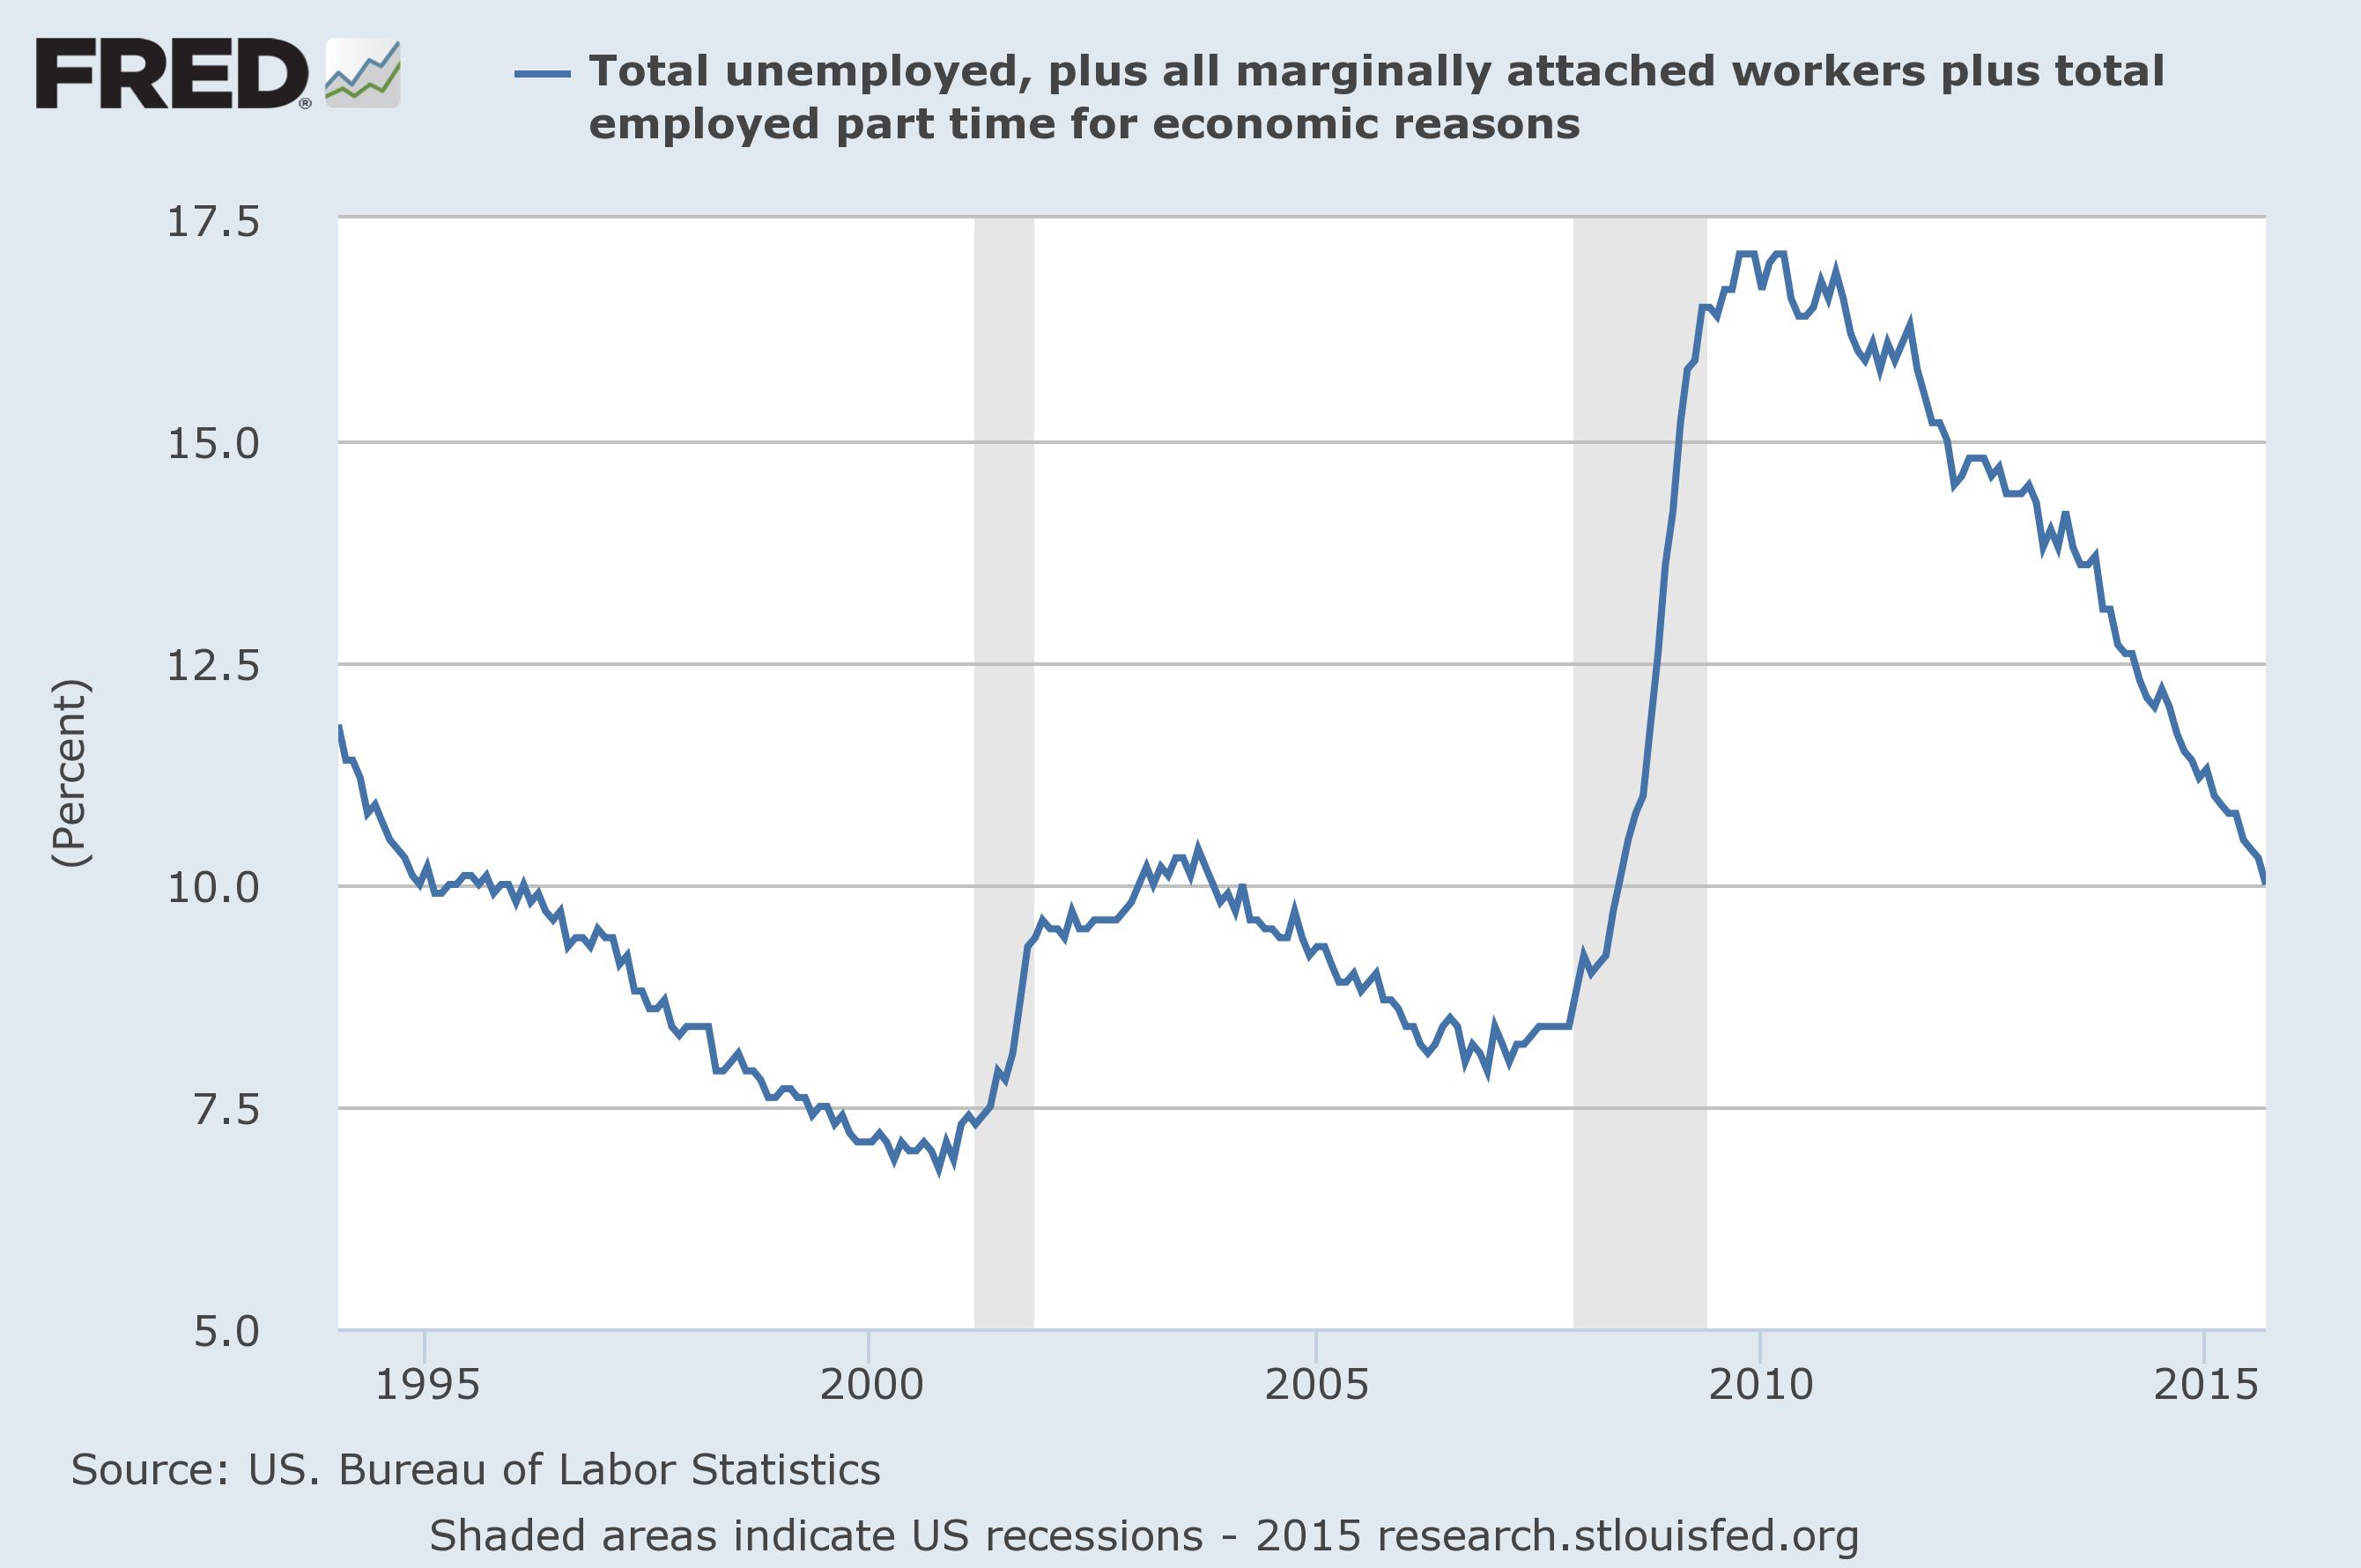
The current level is just now hitting levels near the highs of the previous expansion. Clearly, the labor market could do much better in utilizing this resource.
And finally, the Atlanta Fed’s GDP now predicts a weaker 3Q GDP figure. This increases the possibility that a rate increase will negatively impact a weak macro-economic situation:
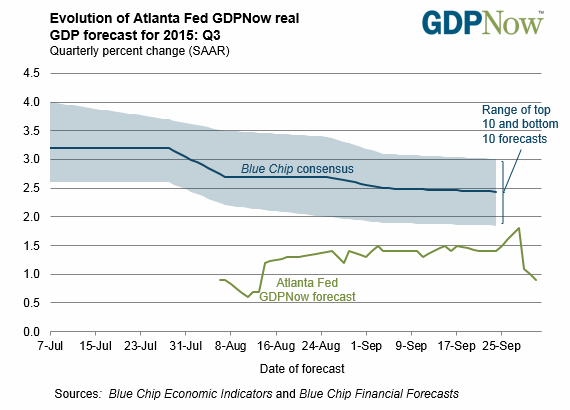
Economic Conclusion: There are few economic reasons for the Fed to raise rates. Price pressures are non-existent and growth is projected to be weaker. It’s highly probable that, from a fundamental perspective, the window for a rate hike as decreased.
Market Overview
First, here is a graph of Treasury yields showing the US 2-, 5-, 10-, and 30-Year CMT:
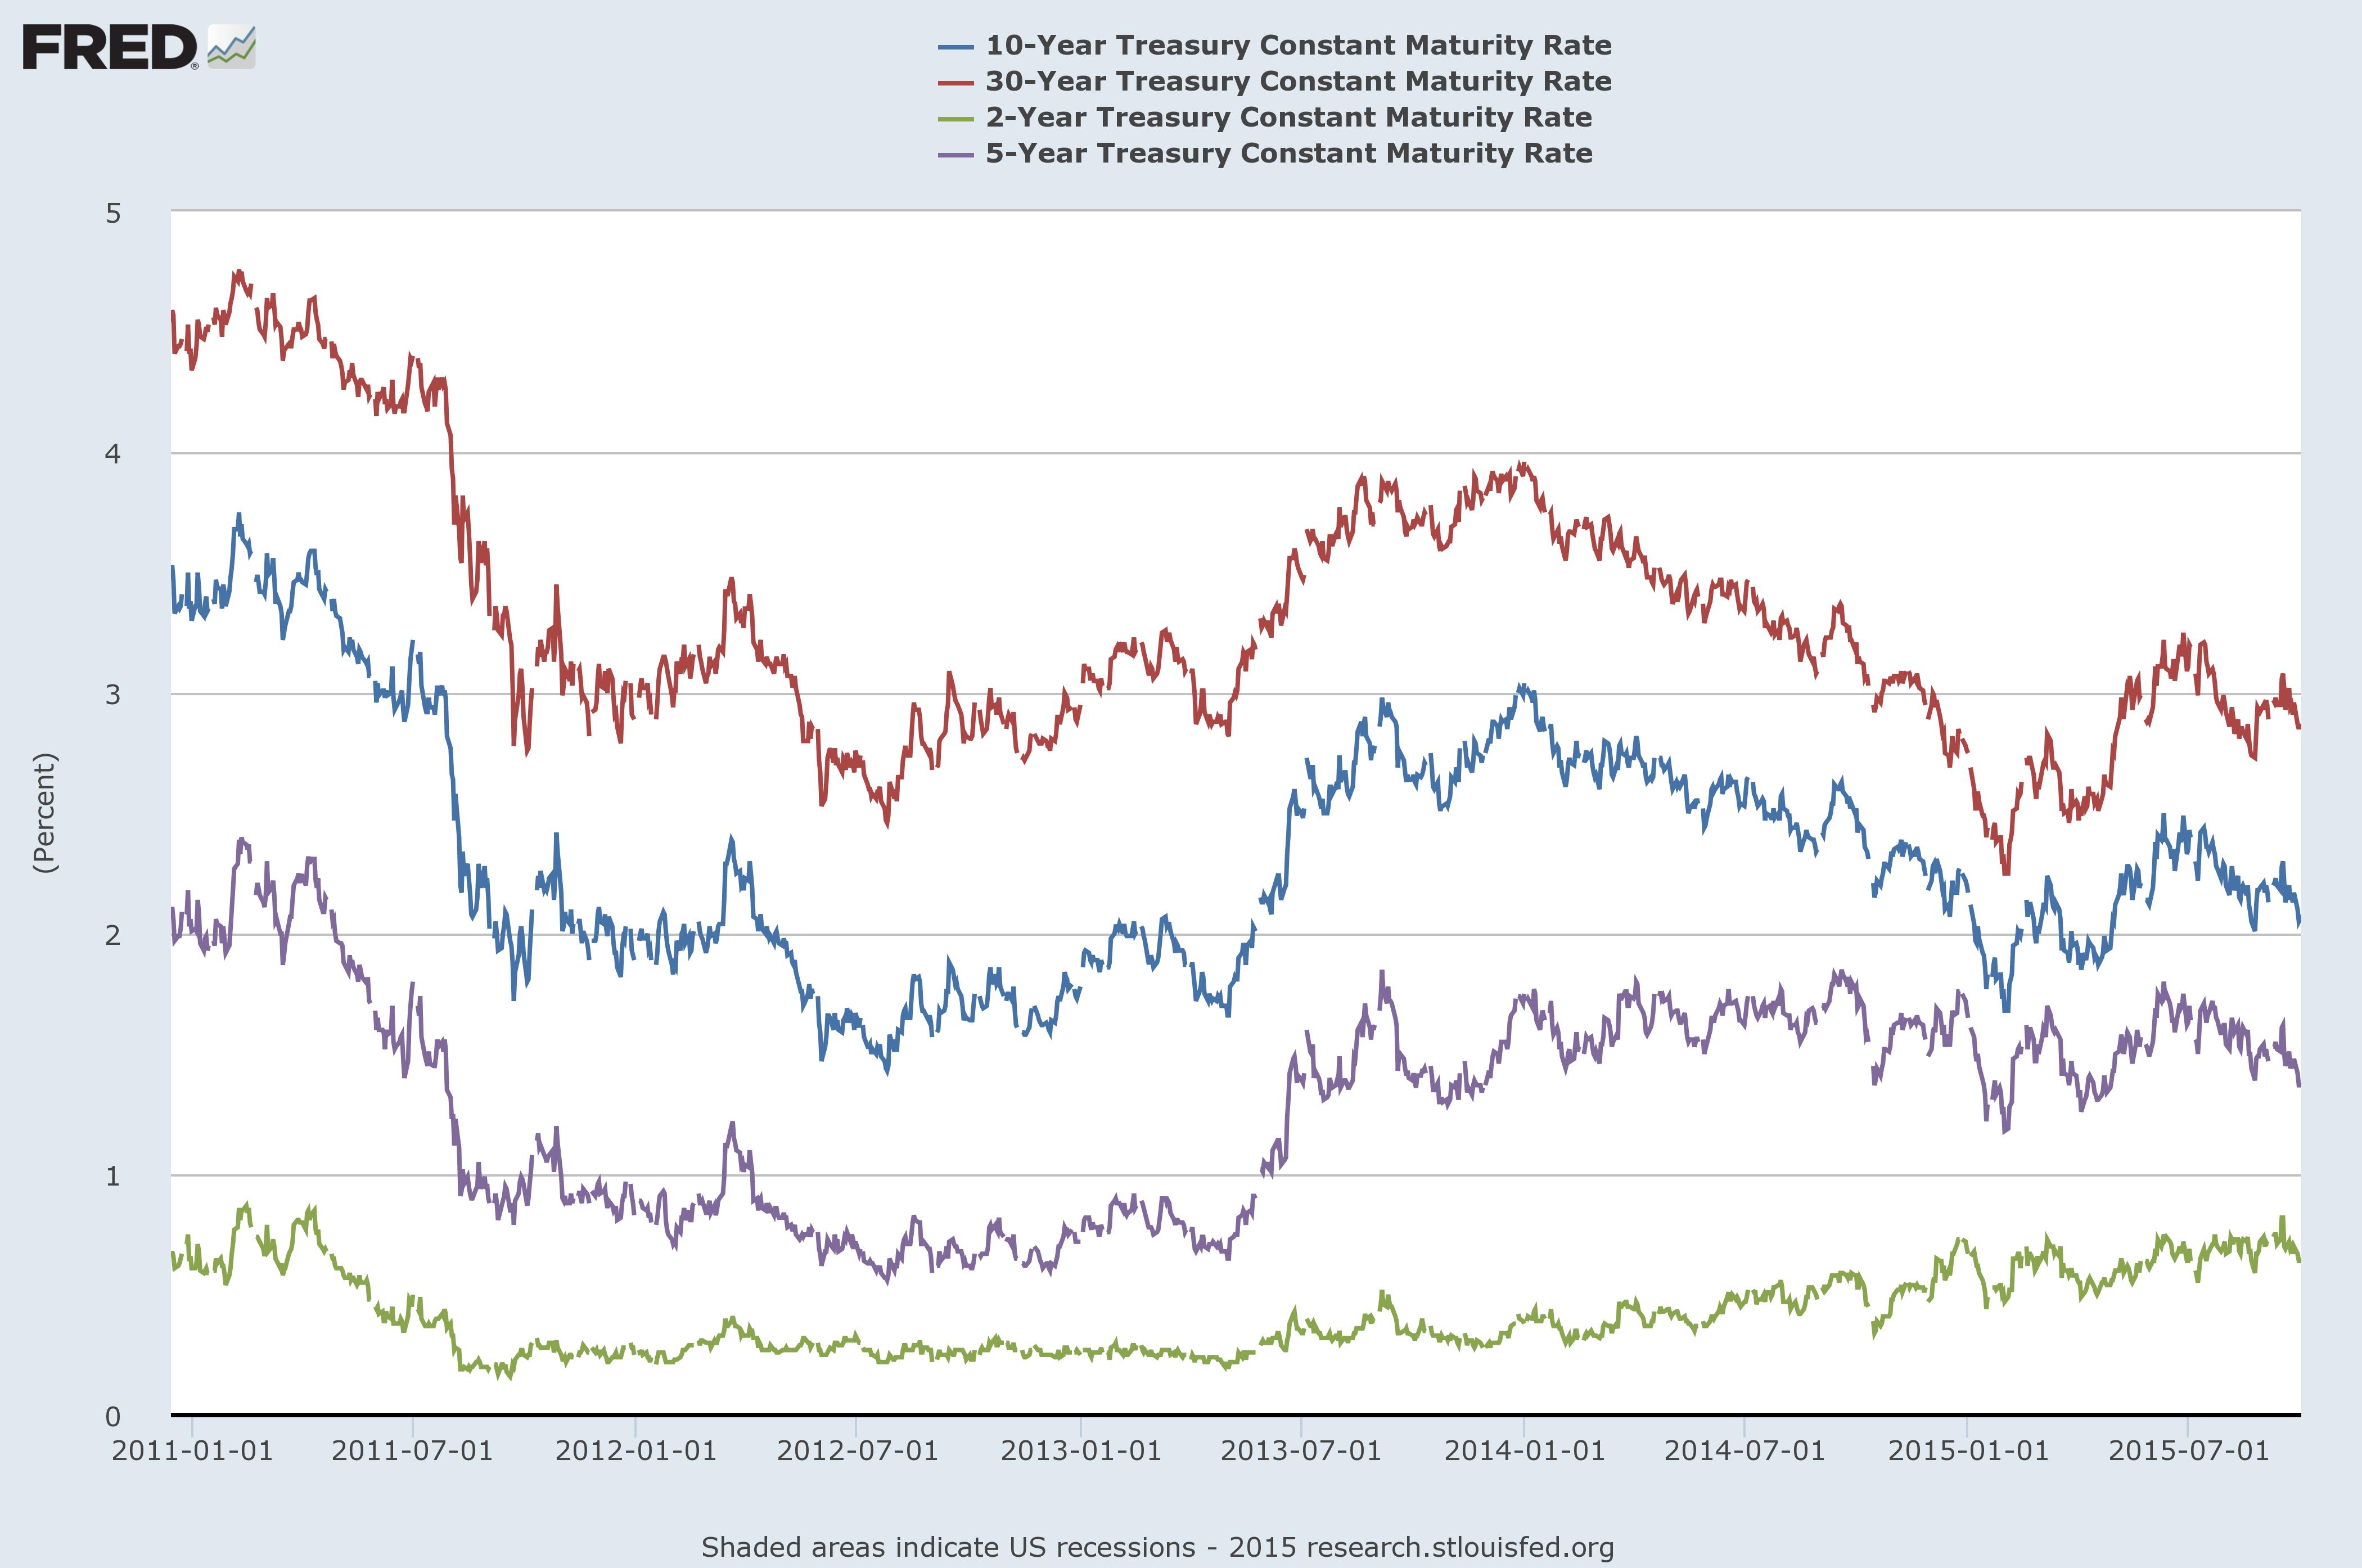
The long end of the curve rallied for all of 2004, lowering the 30 year and 10 year over 150 basis points and 120 basis points, respectively. Both issues sold off for the 1H15, largely in the face of stronger growth and a potential rate hike. But since the beginning of July, both issues have rallied as investors sought the increased safety of treasury bonds in the face of near non-existent inflation and increased equity market volatility. The 30-2 and 10-2 spread shows this situation in more detail:
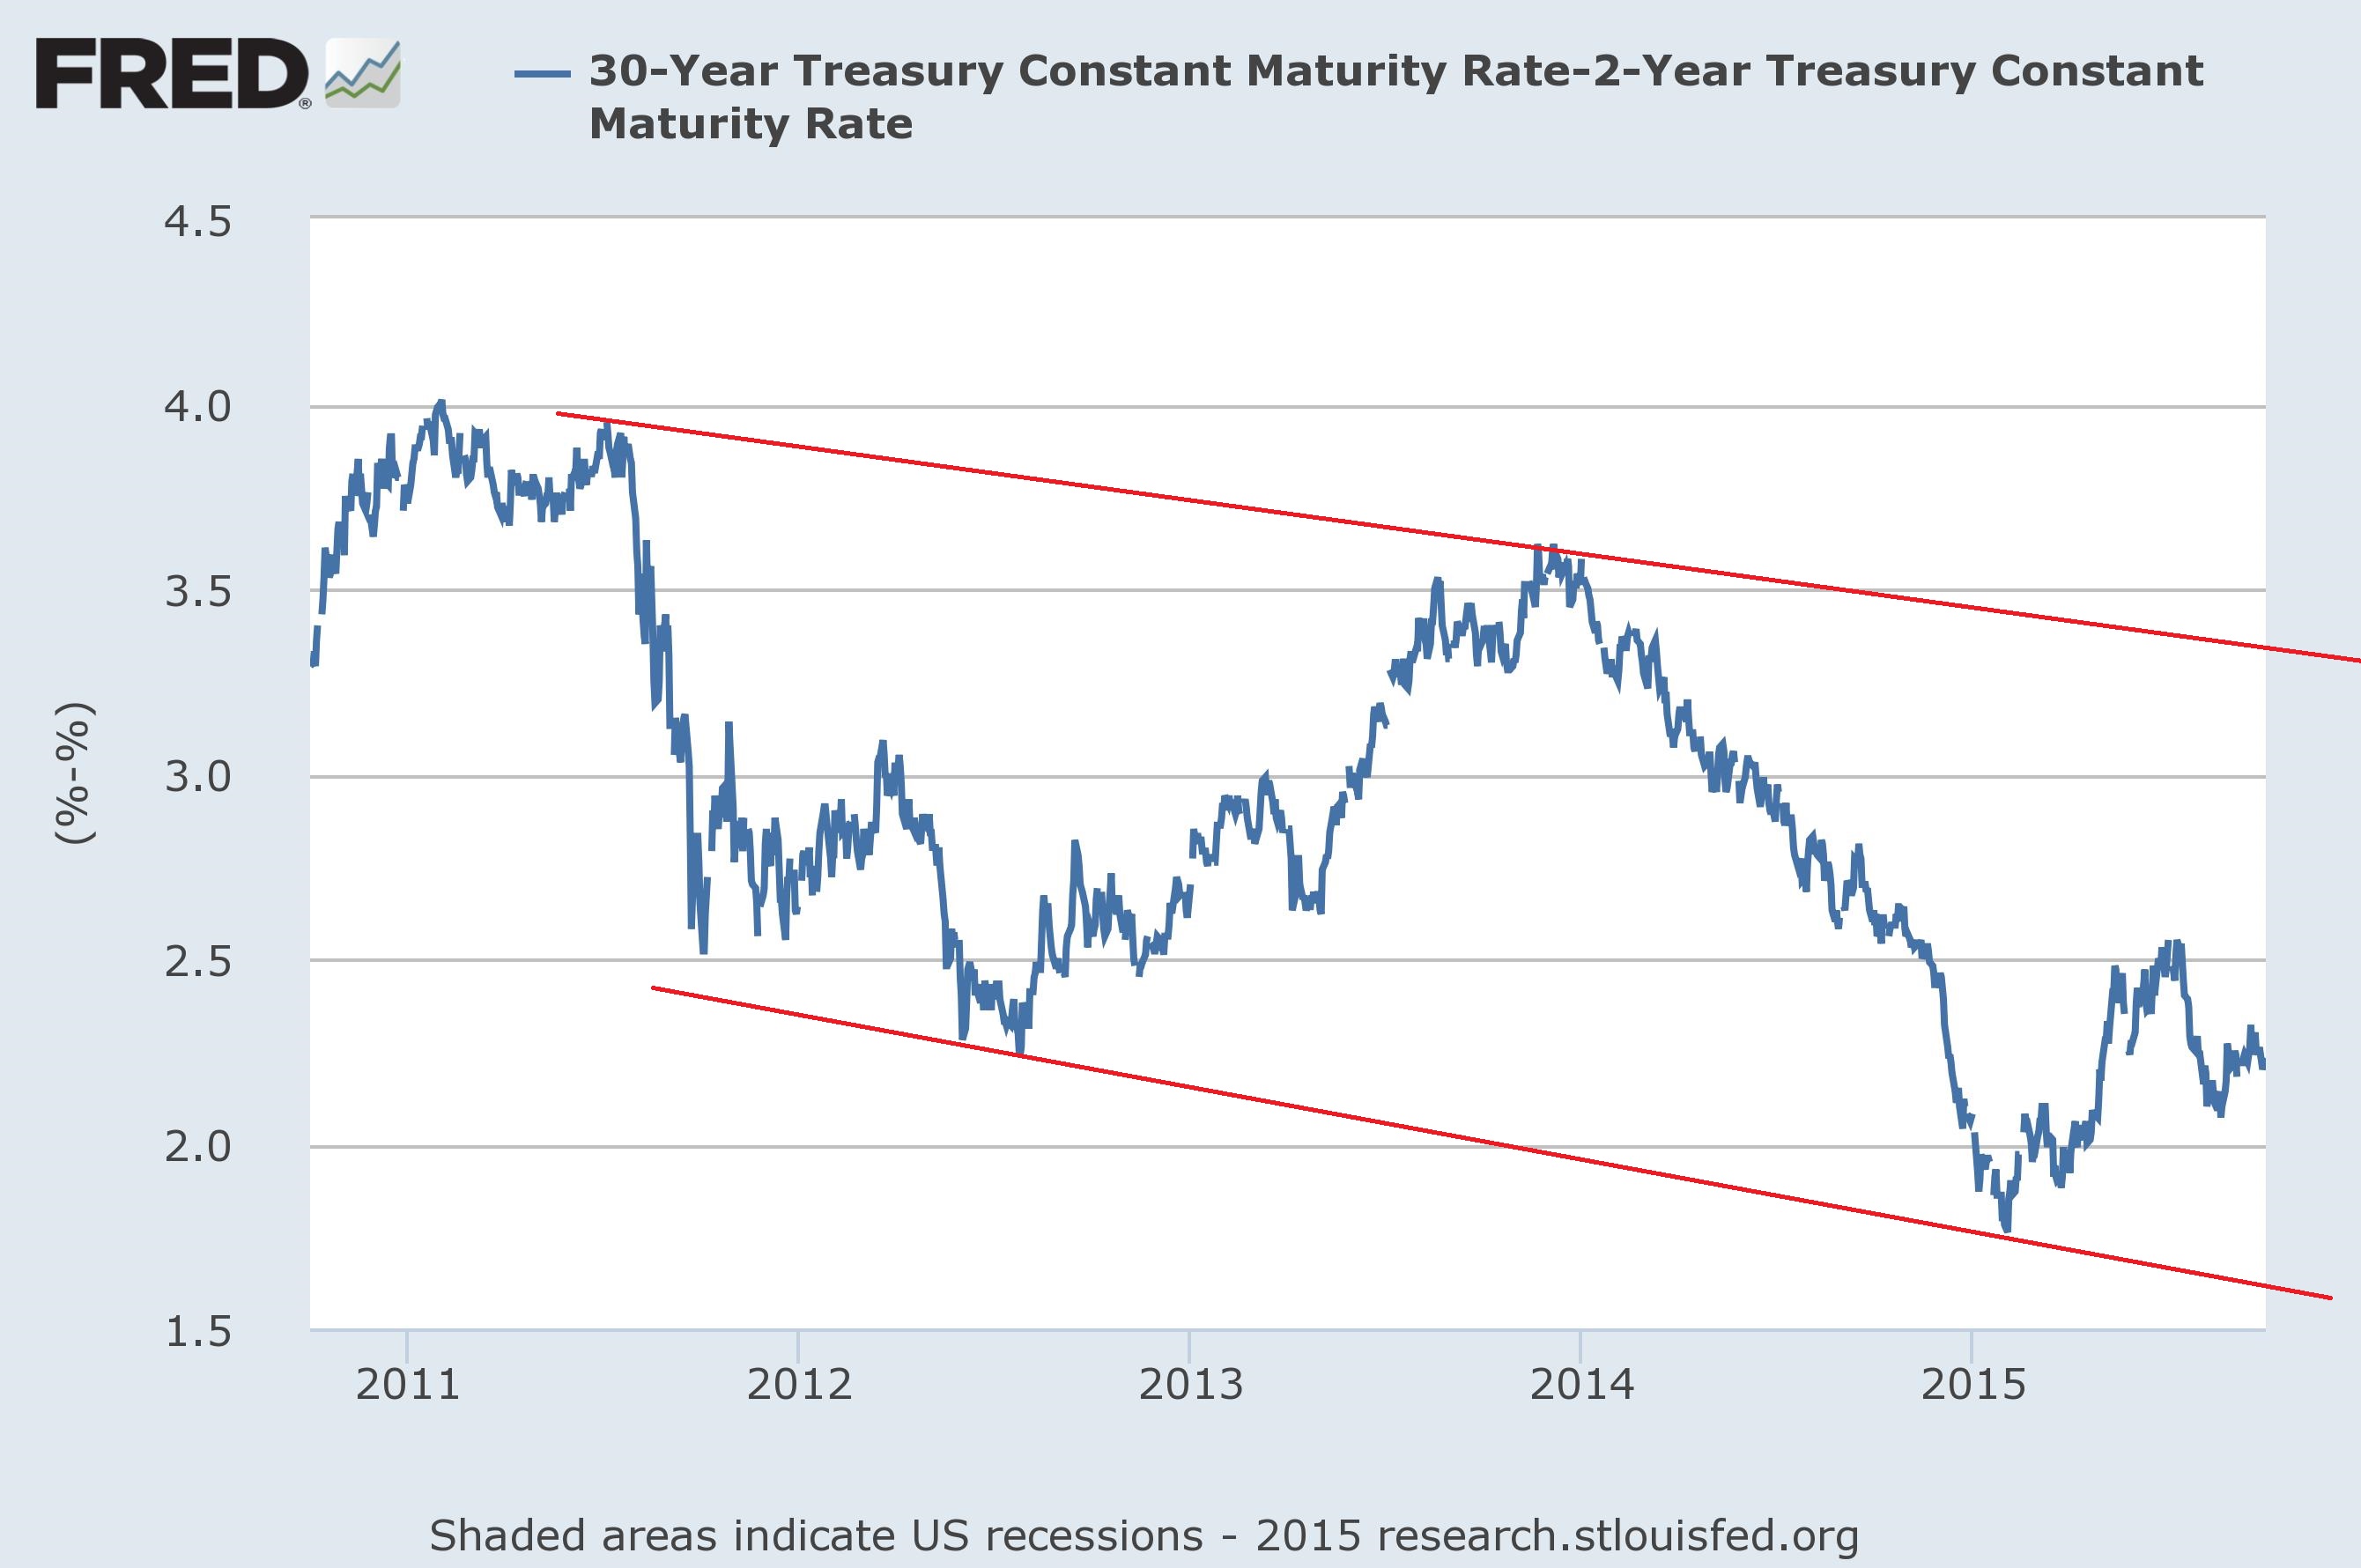
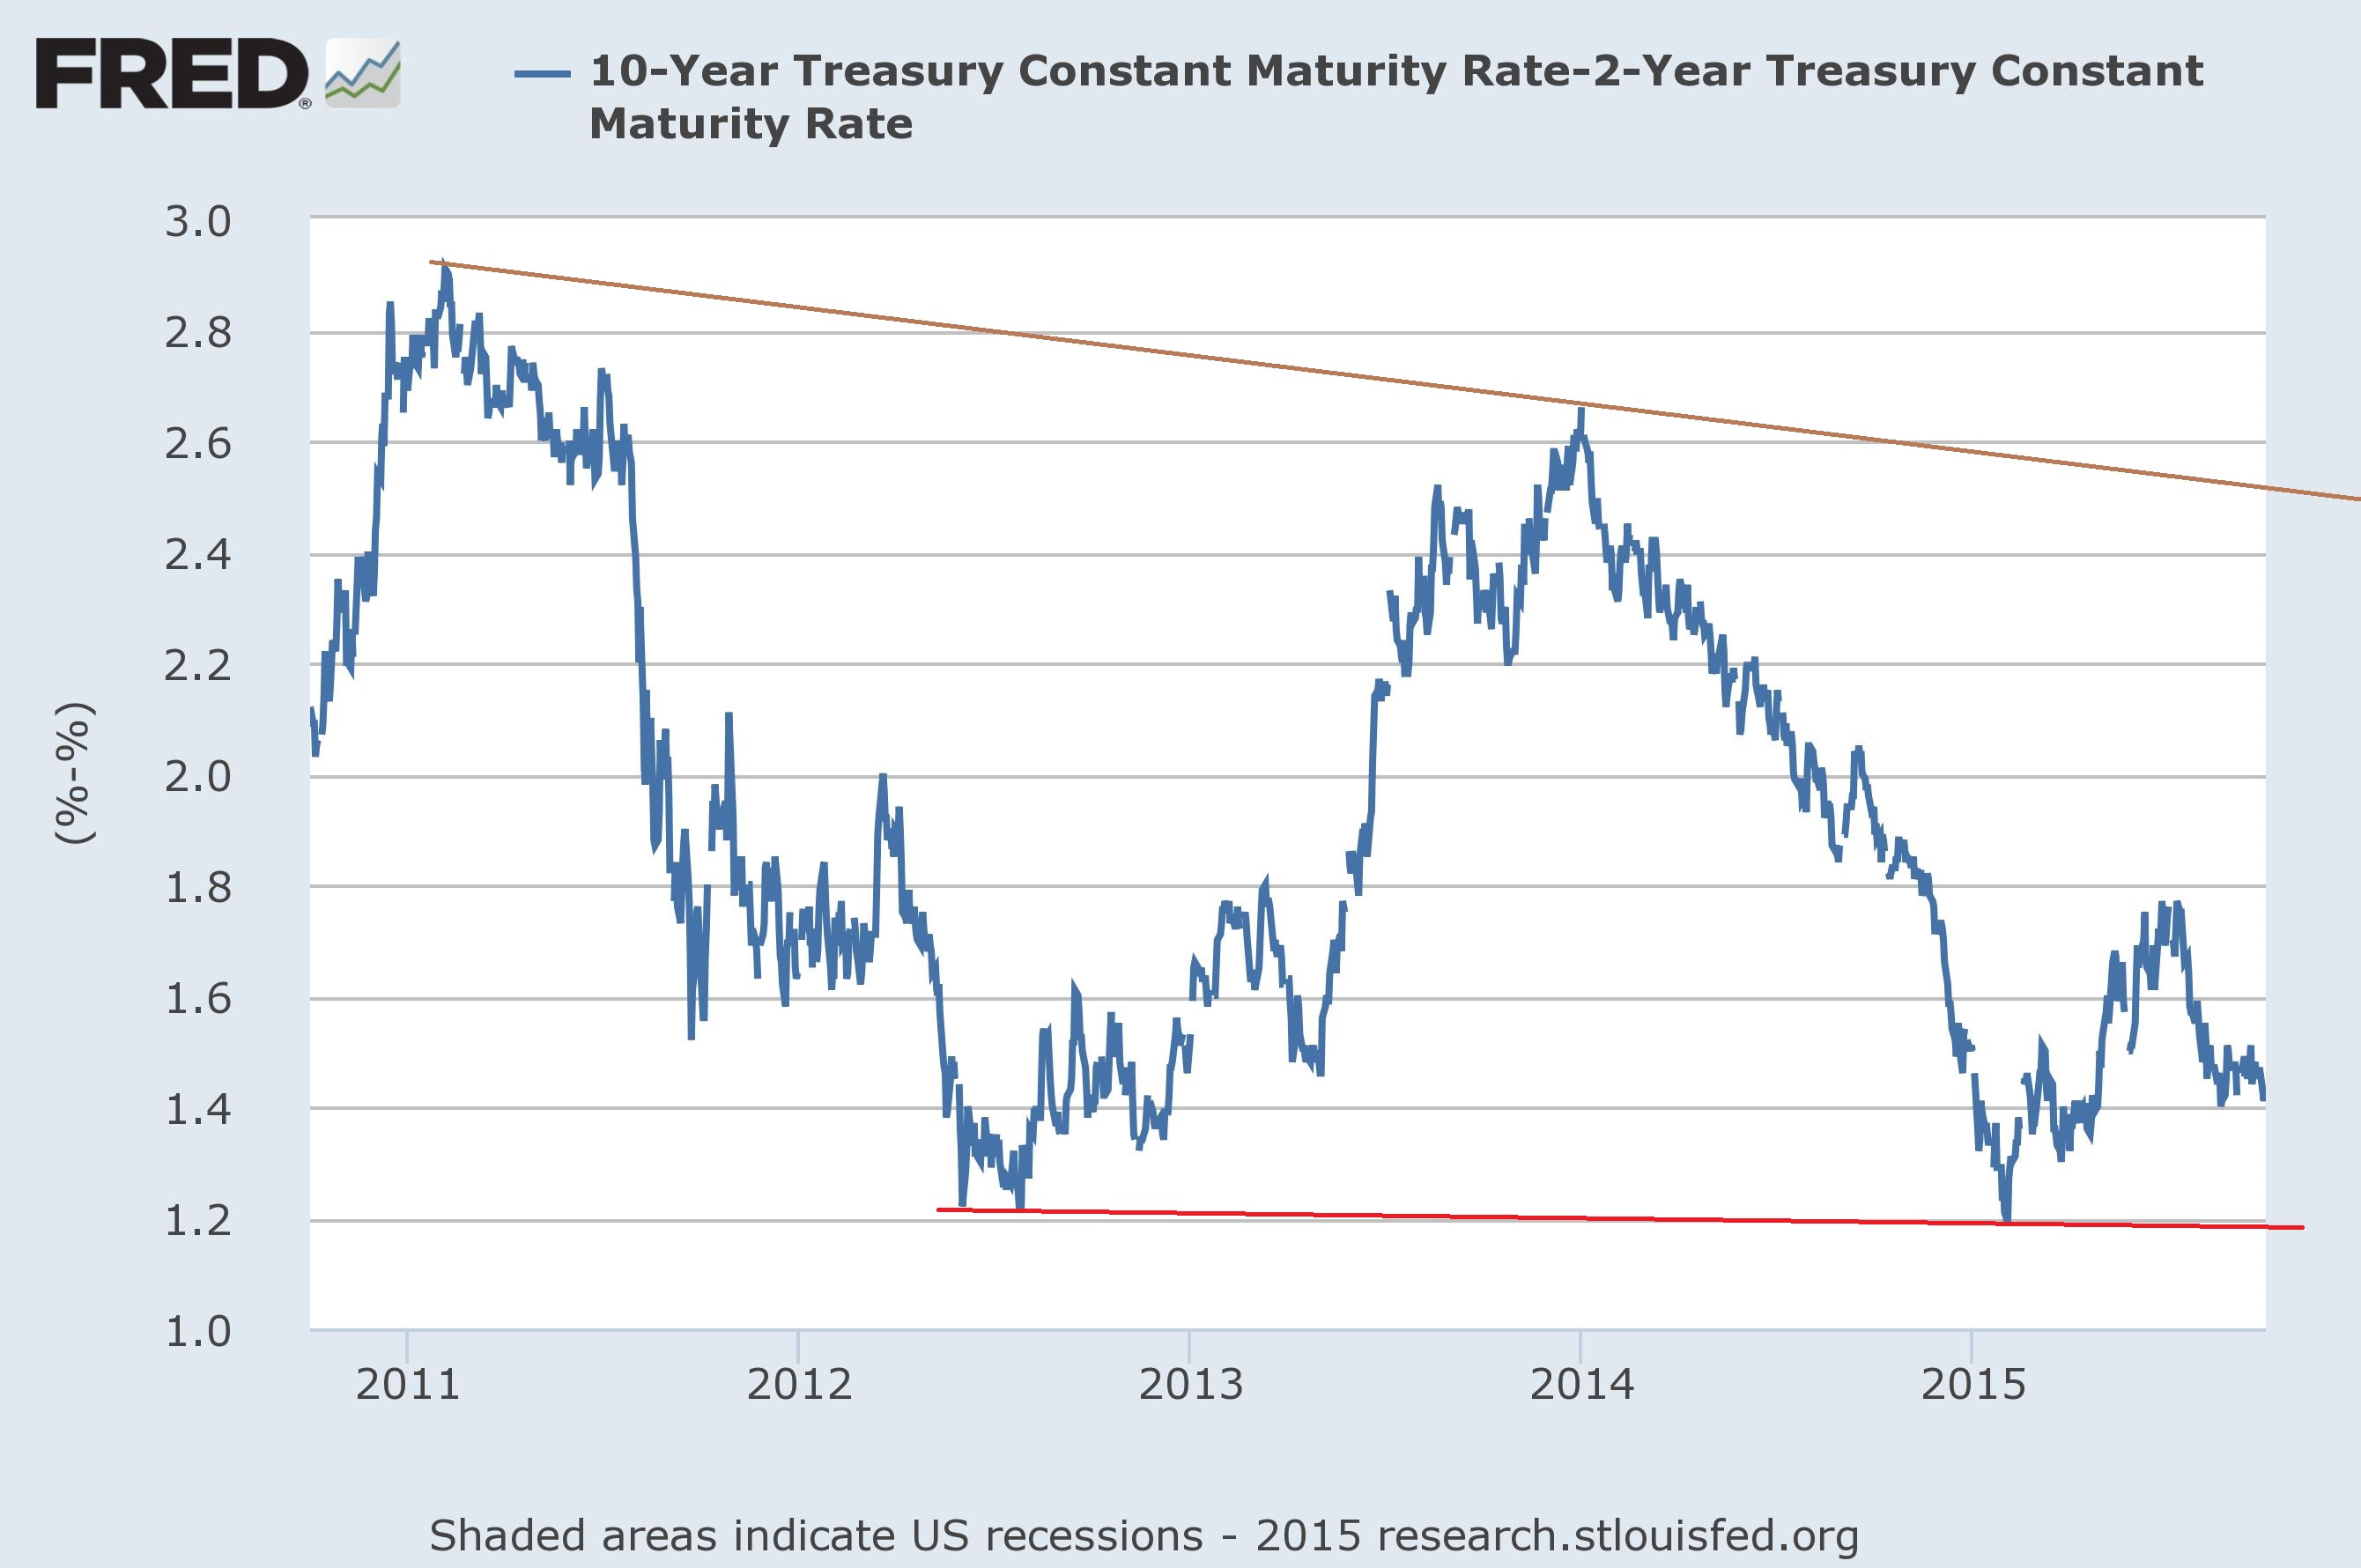
Clearly, the long end has rallied over the last 5 years relative to the short end, flattening the curve by a large amount in both cases. This leads to several conclusions:
- Inflation is a non-issue: Curves don’t flatten if there is even a hint of inflationary pressure.
- Traders aren’t convinced the Fed is going to raise rates in a meaningful way: Because of their increased volatility, the 10 and 30 year bonds are more sensitive to rate moves. If investors thought a protracted rate hike (say 75+ basis points) was in the cards, they’d sell the long end. They haven’t. This indicates that, even if the Fed raises rates 25 basis points, the majority opinion of fixed income investors is, “one and done.”
- There is still a safety bid: because of their high degree of safety, investors buy treasuries when they are concerned about either real or perceived economic negativity. Investors have had a number of potentially negative events over the last year and half to warrant this thinking: Greece and the Ukraine situation in the EU, the Chinese slowdown, potential global deflation and the end of the commodity super-cycle.
- There are serious questions about growth: here is a long chart of the Y/Y percentage change in real GDP, going back over 50 years:
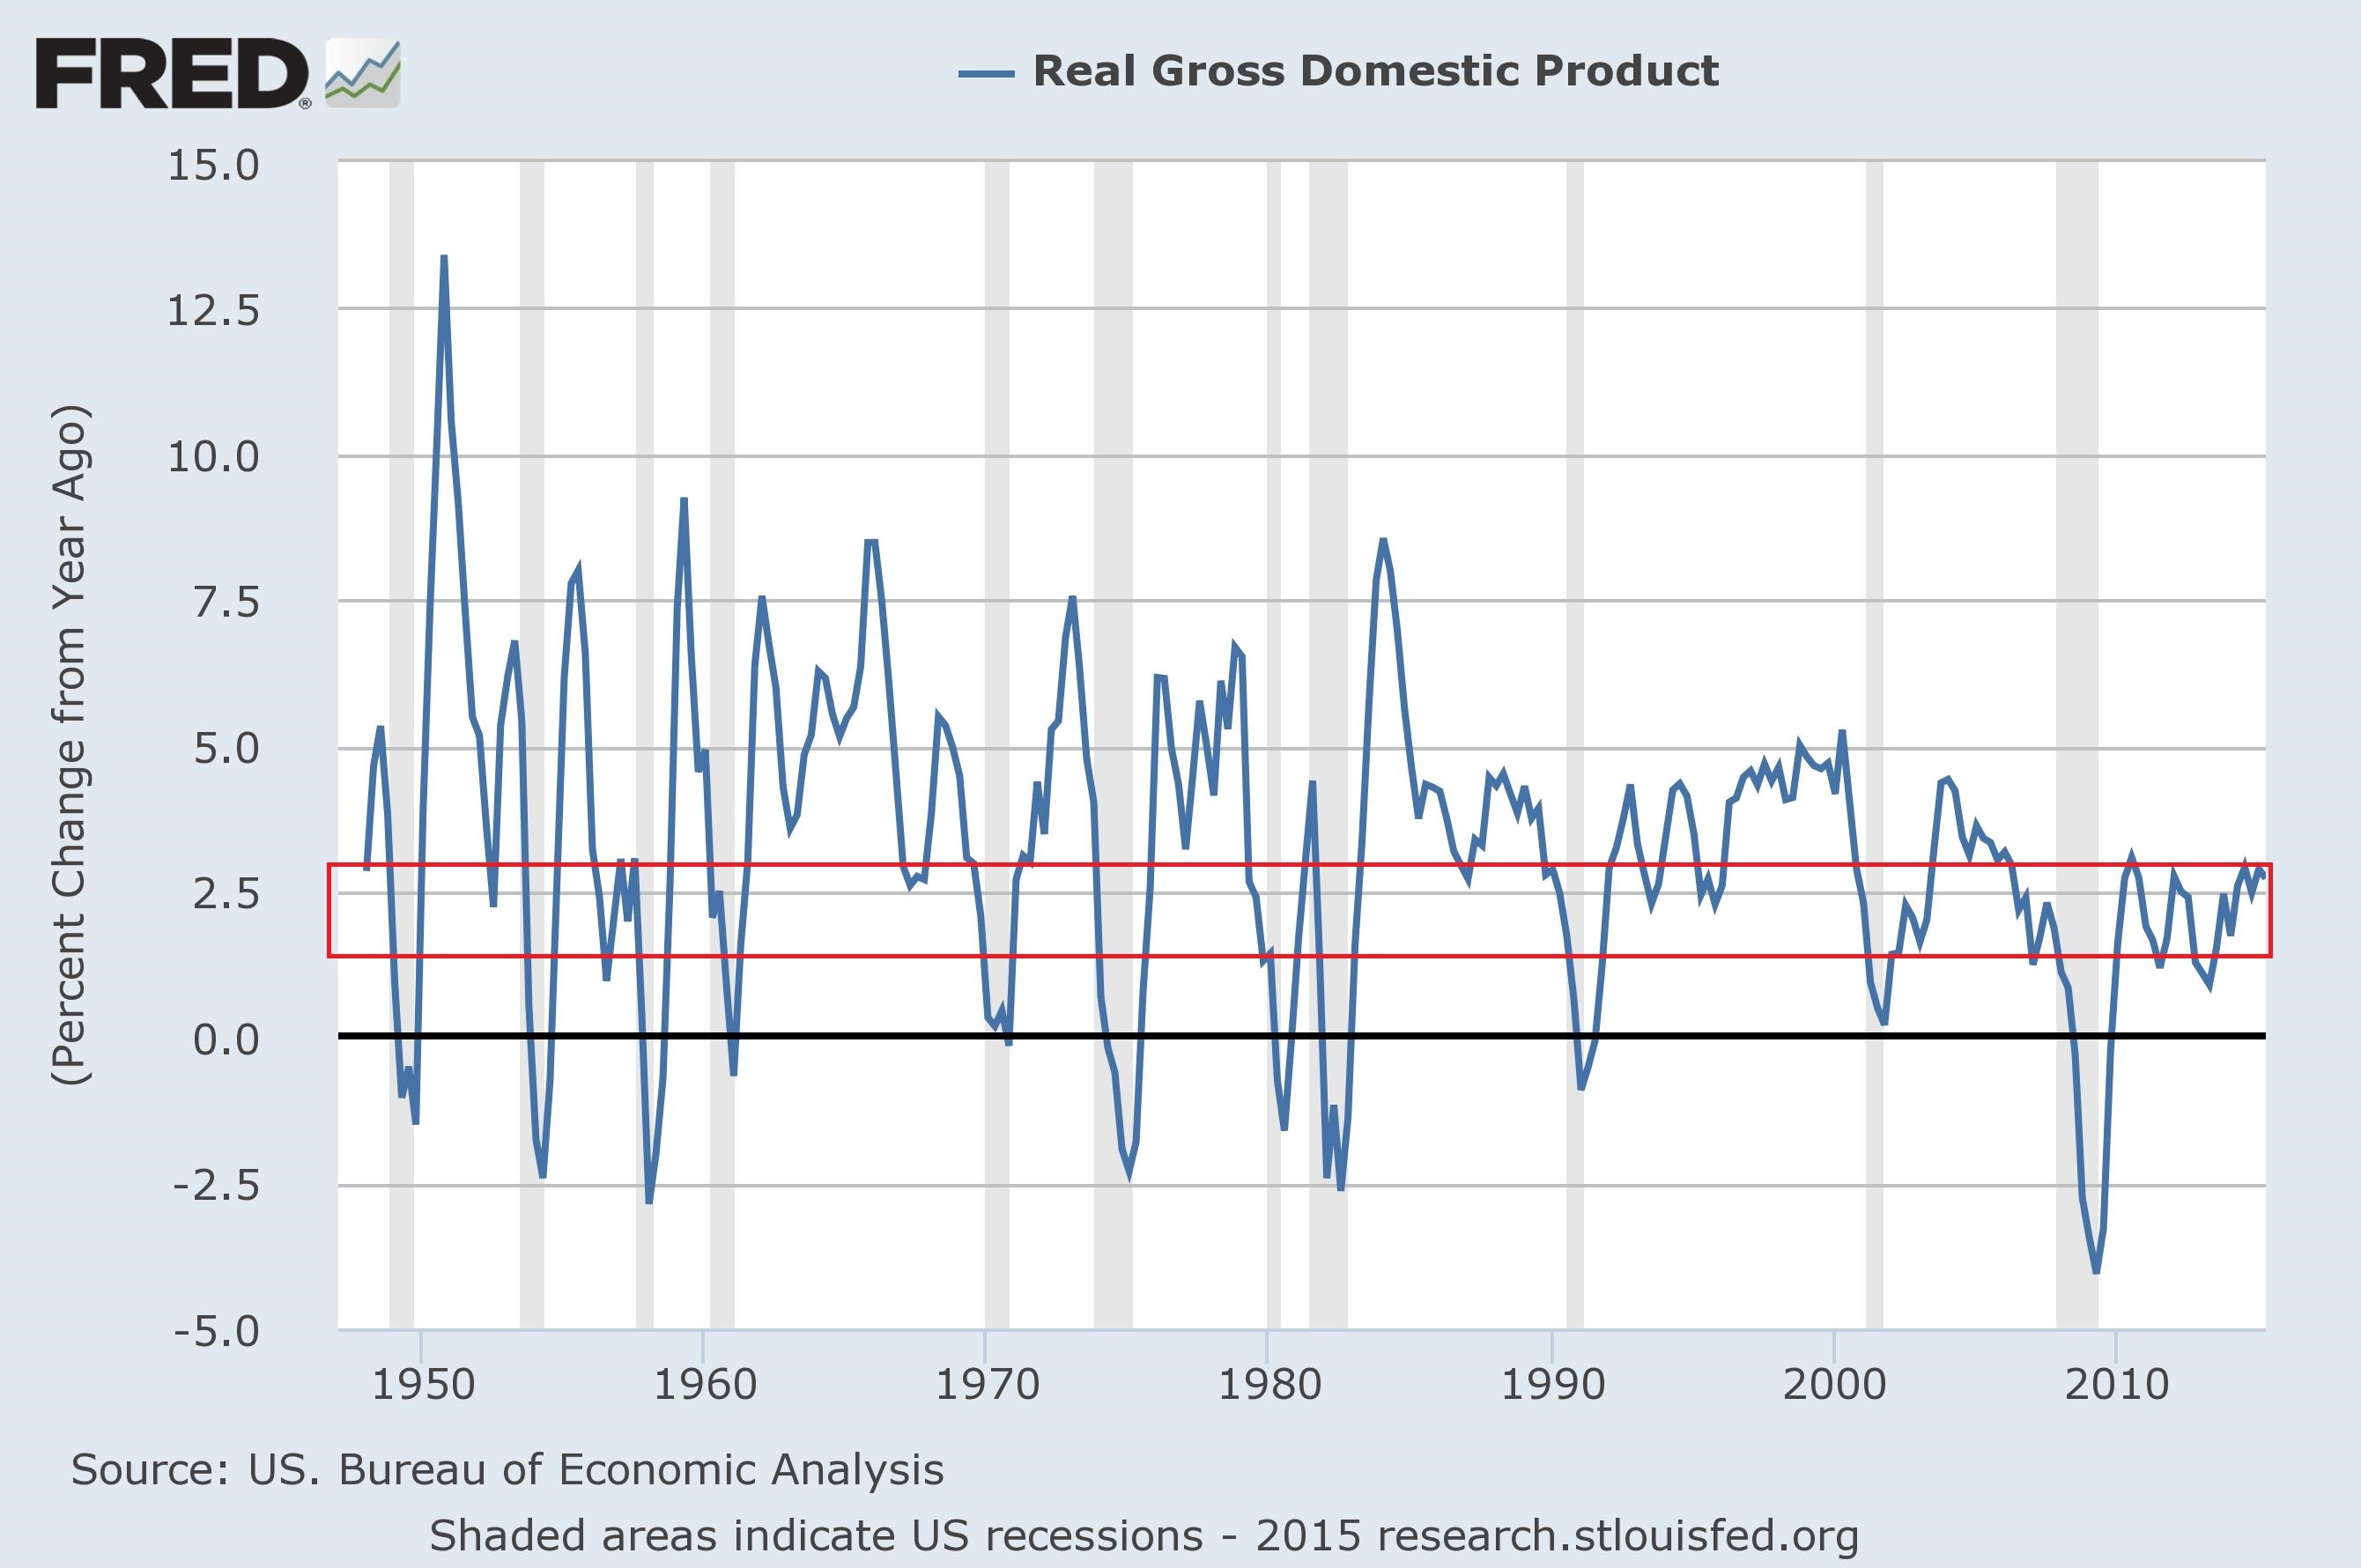
The average range for this expansion is the lowest of any since the Great Depression. Investors don’t see a major top line growth break out or else they’d be selling the long-end seeking higher yield elsewhere.
