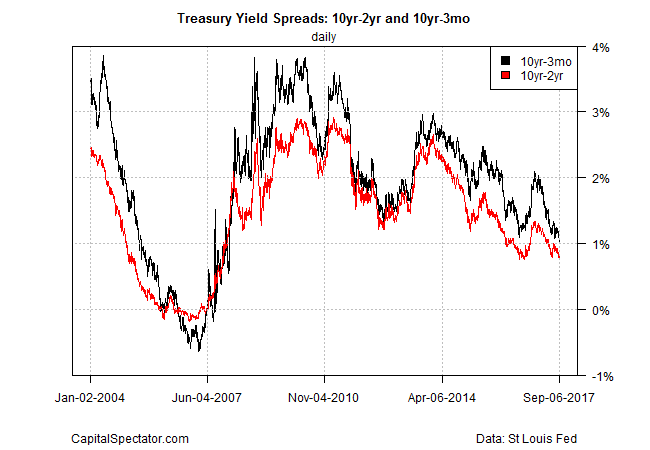
The yield difference on the benchmark 10-year Treasury Note less the 3-Month T-bill fell to 1.03 percentage points on Wednesday (September 6), the lowest since Jan. 2008, according to daily data published by Treasury.gov. The latest dip pushed the spread below the previous post-recession low of 1.08 set in July.
The widely followed 10-year/2-year spread (red line in chart below) remained above its recent low — just barely — after ticking up to 0.80 yesterday. Nonetheless, this spread is close to its previous low of 0.76 in 2016.

Both measures of the Treasury spread have been trending down for much of the year to date and there’s no sign that the slide has run its course. Although the US economy is growing, the crowd has decided to price the Treasury spread in line with the recessionary conditions of 2008. Depending on your view of economic conditions and the relevance of the yield spread generally, the current profile of Treasury rates is either an early warning of trouble ahead or a case of a previously reliable macro signal that’s gone haywire.
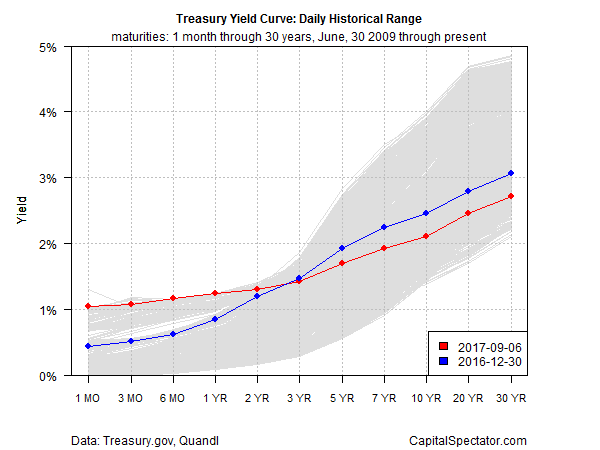
In any case, the Treasury yield curve has flattened this year. Rates on maturities from 3 years up are below levels at 2016’s close while yields on short maturities — 1-month through the 2-year – are up on the year.

Some analysts say that a motley mix of factors is driving the spread lower this year, ranging from disappointment over the inability of the Trump administration to shepherd pro-growth economic legislation through Congress to rising geopolitical risk due to North Korea. Nonetheless, recession risk in the US remains low and the outlook for third-quarter GDP growth is moderately upbeat. CNBC’s survey data for September 6 shows that Wall Street economists are projecting that economic activity will increase 2.8% in Q3, according to the median forecast — slightly below the healthy 3.0% pace in Q2.
Whatever the reason the compression in the 10-year/3-month Treasury spread this year, this data appears to be flirting with an upcoming recessionary signal. Historically, a negative spread has been a reliable indicator that an NBER-defined downturn has started or is about to start.
The question is whether the Treasury curve has lost its power of prognostication after nearly a decade of the Federal Reserve’s extraordinary monetary policy that’s distorted the bond market and interest rates. Some economists assert that the yield curve’s value is as potent as ever, although there’s a fair amount of debate on the topic.
Meantime, the spread continues to trend down. Is this a sign that the economy is weaker than recent data (and near-term expectations) suggest? Or is the relevance of the yield curve breaking down as a useful measure of monitoring business-cycle risk? No knows for sure at this point, but the answer may become clearer in the next round of data.
