
As the major US averages grind to more new highs, I am seeing signs of confirmed upside breakouts everywhere. Consider, for example, this relative performance chart of the S&P 500 SPDR ETF (SPY) against iShares Barclays 7-10 Year Treasury Bond Fund (IEF), which is the ETF for 10-year Treasuries. The ratio staged an upside breakout on the weekly chart, with relative resistance some distance away, indicating considerable upside potential for stocks.
Across the Atlantic, the FTSE 100 staged an upside breakout:
The same could be said of large cap eurozone stocks, as represented by the Euro STOXX 50:
And then there's Greece. Yes, remember that Greece? The Greece whose rating that Fitch recently upgraded.
The European markets are healing, as the WSJ reports, even Greek companies are now tapping the bond markets for financing:
Greek commercial refrigeration and glass bottle producer Frigoglass’s debut bond sale is the latest sign investors are growing more optimistic about Greece, the company’s chief executive said in an interview with Dow Jones Newswires Tuesday.
Frigoglass Monday sold a €250 million ($324.3 million) five-year bond–the second debt sale from a Greek company in as many weeks as the country’s corporate bond market emerges from a deep freeze.
The risk-on mood was also reflected in this account of Slovenia's successful bond financing, after Moody's downgraded the country to junk after its roadshow:
Then the big day came – books reopened, bids were even stronger than during the first attempt and Slovenia sold 3.5bn worth of 5 and 10y bonds. On Friday, the new Sloven23s traded up by more than 4 points, which means yield fell by more than 50bp from the 6% the government paid. A fairy tale ending.
Key risks
Though momentum is positive for stocks in most developed markets, it isn't necessarily all clear sailing ahead. My biggest concern is that China and China-related plays look punk. Here is the Shanghai Composite in a well defined downtrend:
Industrial commodities are also exhibiting a similar downtrend pattern:
The AUD/CAD currency cross, where Australia is more China sensitive and Canada more US sensitive, looks downright ugly.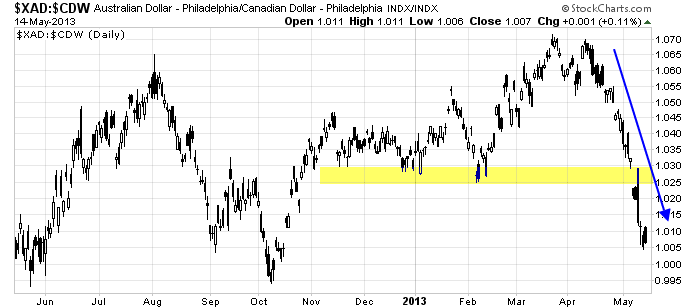 AUD/CAD" title="AUD/CAD" width="696" height="308">
In the US, Ed Yardeni pointed out that forward Street consensus earnings growth is showing signs of stalling. While this isn't a bearish signal yet, it does bear watching. Should forward estimates growth turn negative, it would create considerable headwinds for equities.
My takeaway from the current environment of powerful stock momentum is, "It's OK to get long, but don't forget to look over your shoulder and maintain a tight risk control discipline."
Disclosure: Cam Hui is a portfolio manager at Qwest Investment Fund Management Ltd. ("Qwest"). This article is prepared by Mr. Hui as an outside business activity. As such, Qwest does not review or approve materials presented herein. The opinions and any recommendations expressed in this blog are those of the author and do not reflect the opinions or recommendations of Qwest.
None of the information or opinions expressed in this blog constitutes a solicitation for the purchase or sale of any security or other instrument. Nothing in this article constitutes investment advice and any recommendations that may be contained herein have not been based upon a consideration of the investment objectives, financial situation or particular needs of any specific recipient. Any purchase or sale activity in any securities or other instrument should be based upon your own analysis and conclusions. Past performance is not indicative of future results. Either Qwest or Mr. Hui may hold or control long or short positions in the securities or instruments mentioned.
- English (UK)
- English (India)
- English (Canada)
- English (Australia)
- English (South Africa)
- English (Philippines)
- English (Nigeria)
- Deutsch
- Español (España)
- Español (México)
- Français
- Italiano
- Nederlands
- Português (Portugal)
- Polski
- Português (Brasil)
- Русский
- Türkçe
- العربية
- Ελληνικά
- Svenska
- Suomi
- עברית
- 日本語
- 한국어
- 简体中文
- 繁體中文
- Bahasa Indonesia
- Bahasa Melayu
- ไทย
- Tiếng Việt
- हिंदी
Upside Breakouts Everywhere
Published 05/16/2013, 12:51 AM
Updated 07/09/2023, 06:31 AM
Upside Breakouts Everywhere
Latest comments
Loading next article…
Install Our App
Risk Disclosure: Trading in financial instruments and/or cryptocurrencies involves high risks including the risk of losing some, or all, of your investment amount, and may not be suitable for all investors. Prices of cryptocurrencies are extremely volatile and may be affected by external factors such as financial, regulatory or political events. Trading on margin increases the financial risks.
Before deciding to trade in financial instrument or cryptocurrencies you should be fully informed of the risks and costs associated with trading the financial markets, carefully consider your investment objectives, level of experience, and risk appetite, and seek professional advice where needed.
Fusion Media would like to remind you that the data contained in this website is not necessarily real-time nor accurate. The data and prices on the website are not necessarily provided by any market or exchange, but may be provided by market makers, and so prices may not be accurate and may differ from the actual price at any given market, meaning prices are indicative and not appropriate for trading purposes. Fusion Media and any provider of the data contained in this website will not accept liability for any loss or damage as a result of your trading, or your reliance on the information contained within this website.
It is prohibited to use, store, reproduce, display, modify, transmit or distribute the data contained in this website without the explicit prior written permission of Fusion Media and/or the data provider. All intellectual property rights are reserved by the providers and/or the exchange providing the data contained in this website.
Fusion Media may be compensated by the advertisers that appear on the website, based on your interaction with the advertisements or advertisers.
© 2007-2025 - Fusion Media Limited. All Rights Reserved.