United Parcel Service, Inc. Class B reports preliminary financial results for the quarter ended December 31, 2014.
United Parcel Service (UPS)’ revenue for the fourth quarter climbed 6 percent to $15.9 B compared to the same quarter last year.
UPS delivered 1.3 B packages in the quarter, up 8.1 percent. Daily package volume rose 6.6 percent. Operating expenses rose more than $200 million. Global Q4 shipments climbed 8.1 percent. On a constant currency basis, international revenue rose 5.9 percent to $3.4 B. US operating results were negatively impacted by a higher-than-expected peak related expenses.
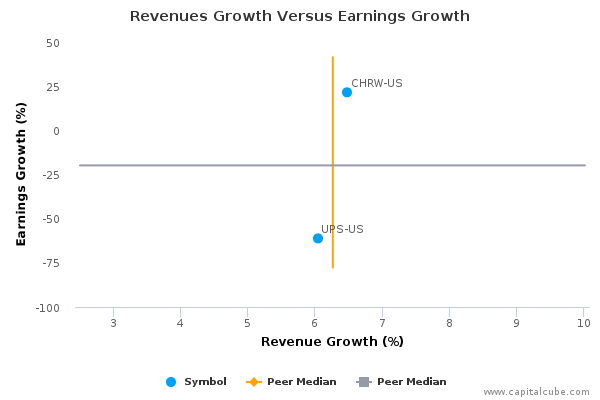
This earnings release follows the earnings announcements from the following peers of United Parcel Service, Inc. Class B – CH Robinson Worldwide Inc (NASDAQ:CHRW).
Highlights
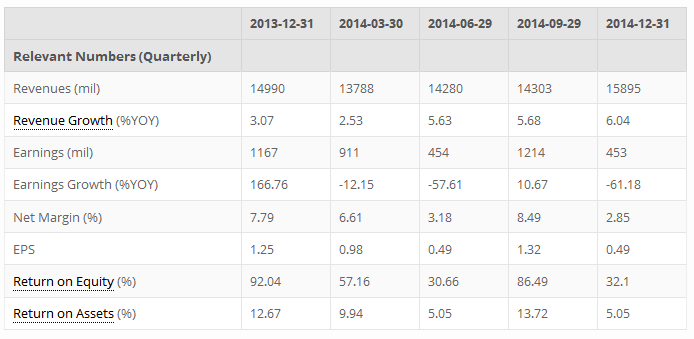
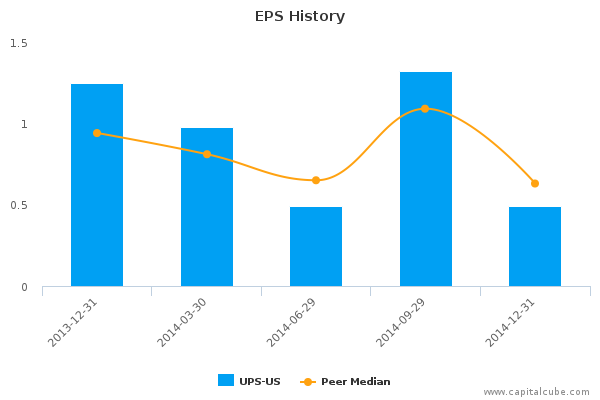
- Summary numbers: Revenues of $15.89 billion, Net Earnings of $453 million, and Earnings per Share (EPS) of $0.49.
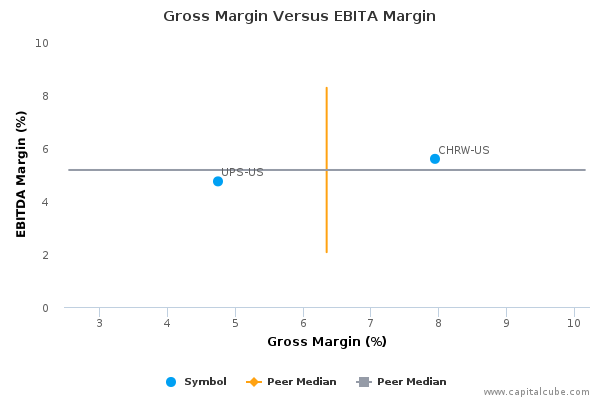
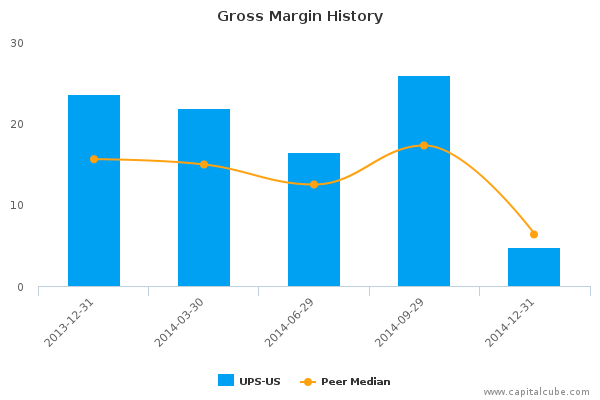
- Gross margins narrowed from 23.55% to 4.74% compared to the same quarter last year, operating (EBITDA) margins now 4.74% from 15.94%.
- Narrowing of operating margins contributed to decline in earnings.
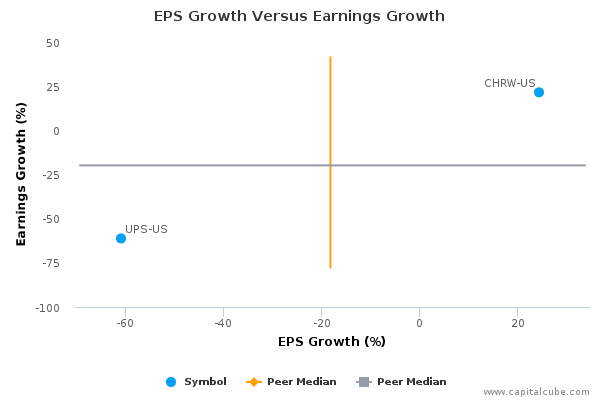
- Earnings per Share (EPS) growth exceeded earnings growth
The table below shows the preliminary results and recent trends for key metrics such as revenues and net income growth:
Market Share Versus Profits
Companies sometimes focus on market share at the expense of profits or earnings growth.
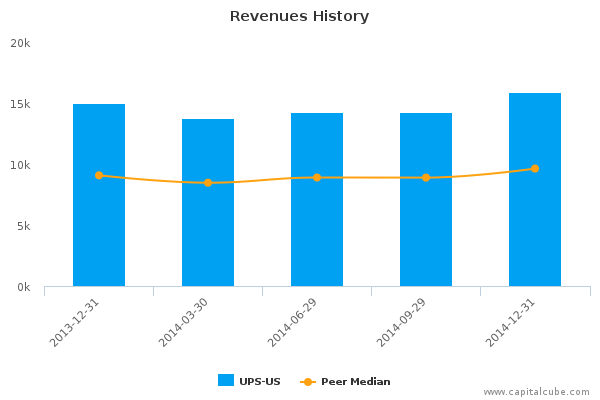
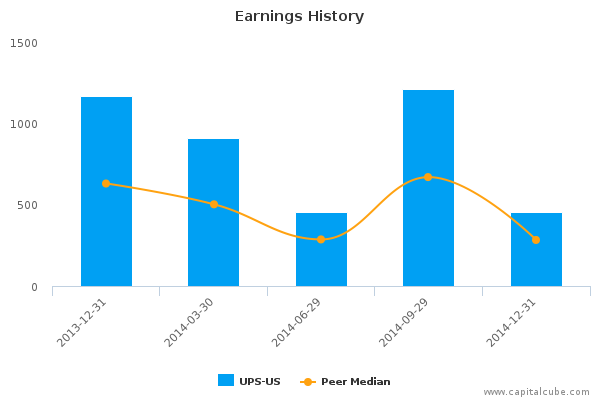
Compared to the same period last year, UPS-US's change in revenue exceeded its change in earnings, which was -61.18%. This suggests perhaps that the company's focus is on market share at the expense of profitability. But more important, this revenue performance is among the lowest thus far in its sector–inviting the potential for current and future loss of market share. Also, for comparison purposes, revenues changed by 11.13% and earnings by -62.69% compared to the quarter ending September 30, 2014.
Earnings Growth Analysis
The company's year-on-year decline in earnings was influenced by a weakening in gross margins from 23.55% to 4.74%, as well as issues with cost controls. As a result, operating margins (EBITDA margins) went fro 15.94% to 4.74% in this time frame. For comparison, gross margins were 25.99% and EBITDA margins were 17.14% in the quarter ending September 30, 2014.
Gross Margin Trend
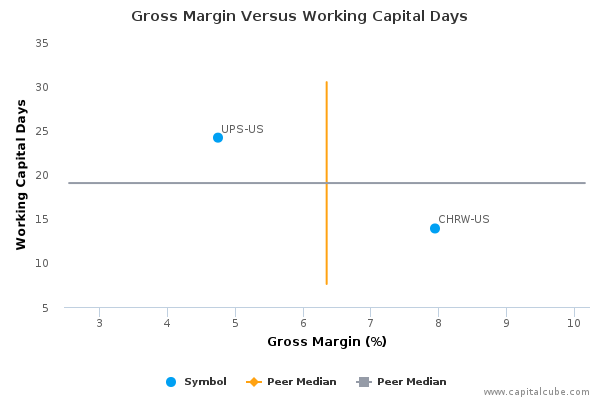
Companies sometimes sacrifice improvements in revenues and margins in order to extend friendlier terms to customers and vendors. Capital Cube probes for such activity by comparing the changes in gross margins with any changes in working capital. If the gross margins improved without a worsening of working capital, it is possible that the company's performance is a result of truly delivering in the marketplace and not simply an accounting prop-up using the balance sheet.
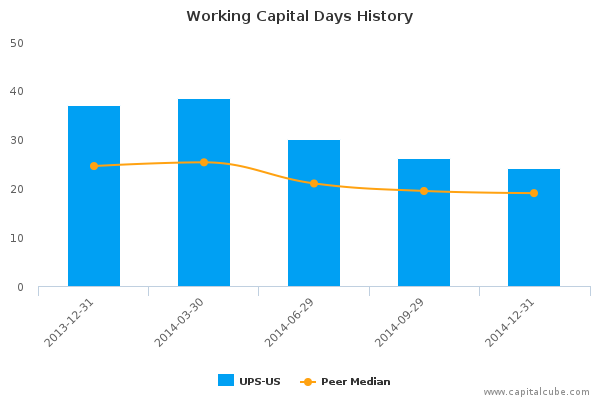
UPS-US's decline in gross margins were offset by some improvements on the balance sheet. The management of working capital, for example, shows progress. The company's working capital days have fallen to 24.17 days from 37.01 days for the same period last year. This leads Capital Cube to conclude that the gross margin decline is not altogether bad.
Cash Versus Earnings – Sustainable Performance?
Margins
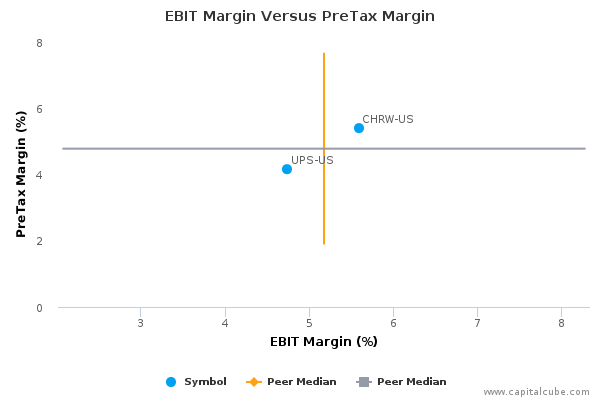
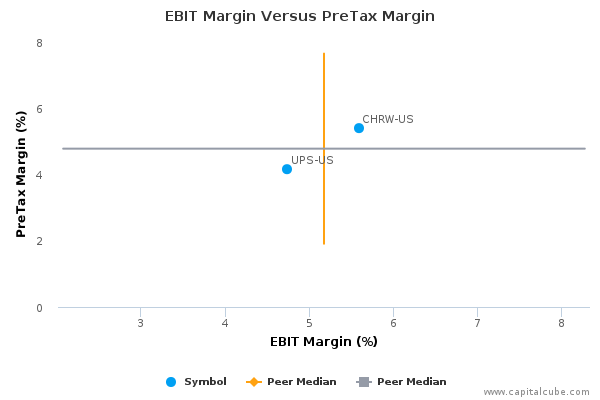
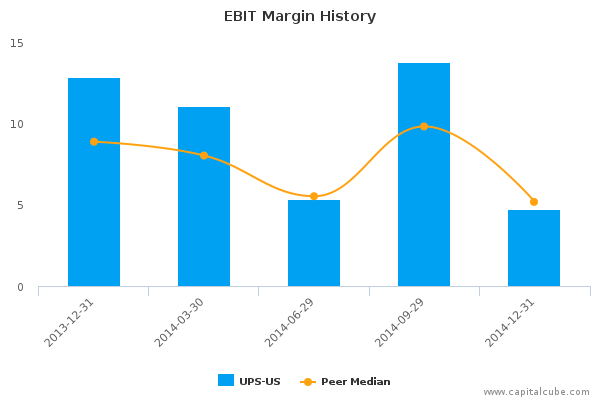
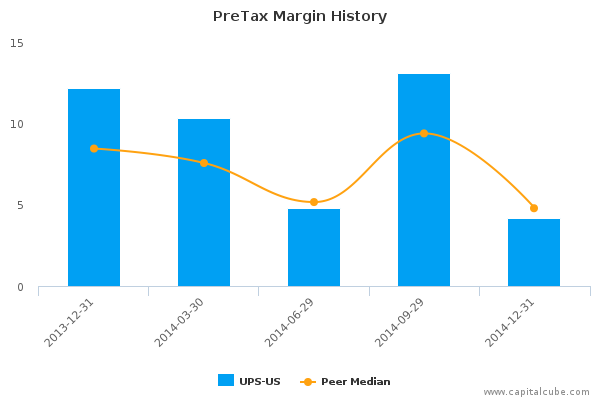
The company's decline in earnings has been influenced by the following factors: (1) Decline in operating margins (EBIT margins) from 12.82% to 4.74% and (2) one-time items that contributed to a decrease in pretax margins from 12.17% to 4.16%
EPS Growth Versus Earnings Growth
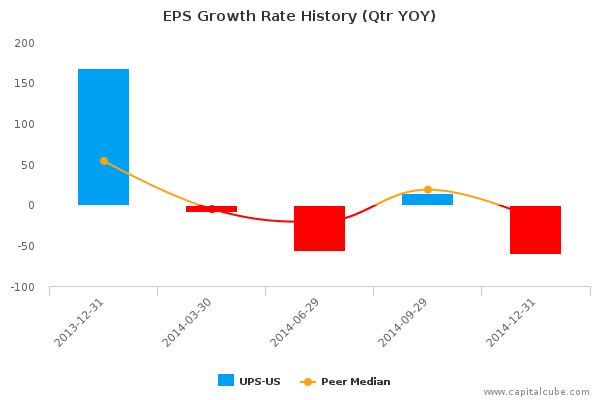
UPS-US's change in Earnings per Share (EPS) of -60.80% compared to the same quarter last year is better than its change in earnings of -61.18%. At the same time, this change in earnings is less than the peer average among the results announced by its peer group, suggesting that the company is losing ground in generating profits from its competitors.
Company Profile
United Parcel Service, Inc. is a logistics company, which provides global package delivery and supply chain management services. It offers logistics services to the global market, which include transportation, distribution, forwarding, ground, ocean and air freight, brokerage and financing. The company operates its business through three segments: U.S. Domestic Package, International Package and Supply Chain & Freight. The U.S. Domestic Package segment provides in time-definite, money-back guaranteed, small package delivery services and also offers spectrum of U.S. domestic guaranteed ground and air package transportation services. The International Package segment offers a wide selection of guaranteed, day and time-definite international shipping services. The Supply Chain & Freight segment consists of its forwarding and logistics services, UPS Freight business, and its financial offerings through UPS Capital. United Parcel Service was founded by James E. Casey and Claude Ryan on August 28, 1907 and is headquartered in Atlanta, GA.
