Last night, we (Deron and Rick) spent several hours manually scanning the chart patterns of more than 900 stocks and ETFs. While our web-based stock screener is a fantastic time saver in steadily trending markets, markets in transition require the added interaction of human discretion.
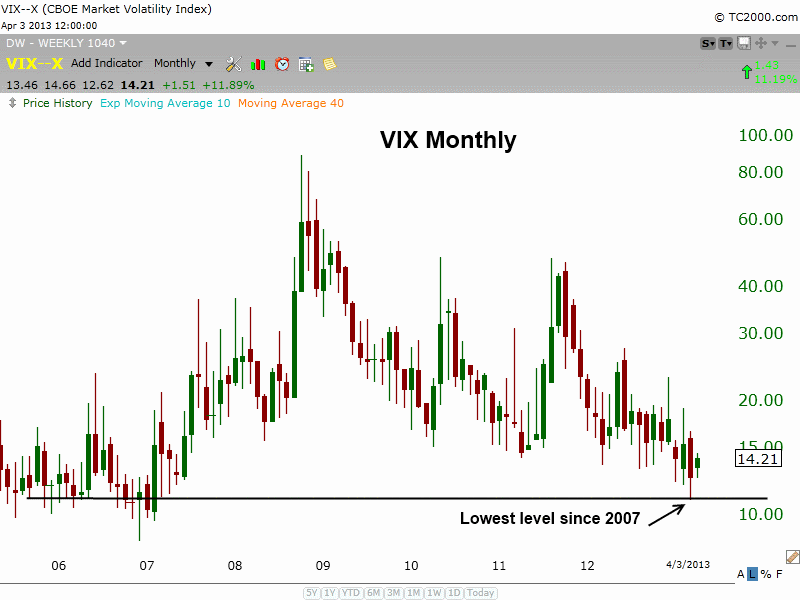
The CBOE Market Volatility Index (VIX) is a contrarian index that essentially measures the level of fear in the market at any given time (which is based on market volatility). The lower the price of the index, the less fear in the market. Generally speaking, the less fear in the market, the greater the chances of a significant market correction being around the corner.
In mid-March, the VIX was trading at its lowest level since 2007. Over the past month, the VIX has moved slightly higher, and is now forming a short-term base just off its low. Given that we are now on a new sell signal, which means market conditions have suddenly gotten very ugly, there’s a strong possibility we will see a swift spike in the VIX in the coming days (hence the potential buy setup in VXZ that follows). The long-term monthly chart of VIX is shown below:
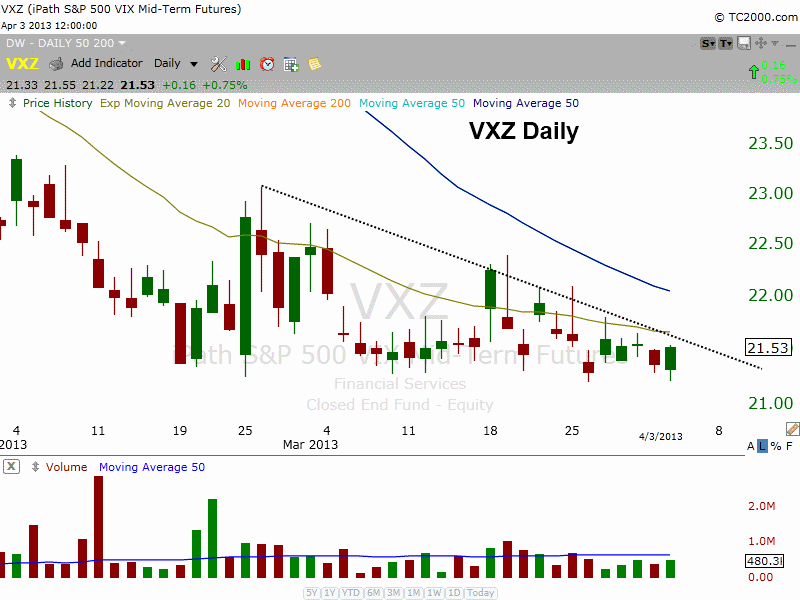
Going into today, iPath S&P 500 VIX Mid-Term Futures (VXZ) is a new “official” ETF buy setup on our member watchlist. But first of all, I must be very quick to point out this potential trade does NOT fall within the technical parameters of our normal methodology for buying trend reversals. Rather, this is intended to purely be a momentum-based trade of a very short-term nature (estimated 2 to 5 days holding time). The daily chart of VXZ is shown below:
We still have QQQ on our internal watchlist as a potential short entry (or inverse ETF entry), due to the head and shoulders pattern on its weekly chart (review our recent analysis of QQQ here on our trading blog). However, that setup has not yet met our requirements for new trade entry. Stay tuned for follow-up.
Original post
- English (UK)
- English (India)
- English (Canada)
- English (Australia)
- English (South Africa)
- English (Philippines)
- English (Nigeria)
- Deutsch
- Español (España)
- Español (México)
- Français
- Italiano
- Nederlands
- Português (Portugal)
- Polski
- Português (Brasil)
- Русский
- Türkçe
- العربية
- Ελληνικά
- Svenska
- Suomi
- עברית
- 日本語
- 한국어
- 简体中文
- 繁體中文
- Bahasa Indonesia
- Bahasa Melayu
- ไทย
- Tiếng Việt
- हिंदी
Unsual And Quick Momentum-Based ETF Swing Trade Setup
Published 04/05/2013, 01:01 AM
Updated 07/09/2023, 06:31 AM
Unsual And Quick Momentum-Based ETF Swing Trade Setup
Latest comments
Loading next article…
Install Our App
Risk Disclosure: Trading in financial instruments and/or cryptocurrencies involves high risks including the risk of losing some, or all, of your investment amount, and may not be suitable for all investors. Prices of cryptocurrencies are extremely volatile and may be affected by external factors such as financial, regulatory or political events. Trading on margin increases the financial risks.
Before deciding to trade in financial instrument or cryptocurrencies you should be fully informed of the risks and costs associated with trading the financial markets, carefully consider your investment objectives, level of experience, and risk appetite, and seek professional advice where needed.
Fusion Media would like to remind you that the data contained in this website is not necessarily real-time nor accurate. The data and prices on the website are not necessarily provided by any market or exchange, but may be provided by market makers, and so prices may not be accurate and may differ from the actual price at any given market, meaning prices are indicative and not appropriate for trading purposes. Fusion Media and any provider of the data contained in this website will not accept liability for any loss or damage as a result of your trading, or your reliance on the information contained within this website.
It is prohibited to use, store, reproduce, display, modify, transmit or distribute the data contained in this website without the explicit prior written permission of Fusion Media and/or the data provider. All intellectual property rights are reserved by the providers and/or the exchange providing the data contained in this website.
Fusion Media may be compensated by the advertisers that appear on the website, based on your interaction with the advertisements or advertisers.
© 2007-2025 - Fusion Media Limited. All Rights Reserved.
