Two names today, one that reports after the close tonight International Business Machines (NYSE:IBM), , and one before the open Tuesday, Under Armour Inc (NYSE:UA).
International Business Machines (NYSE:IBM)
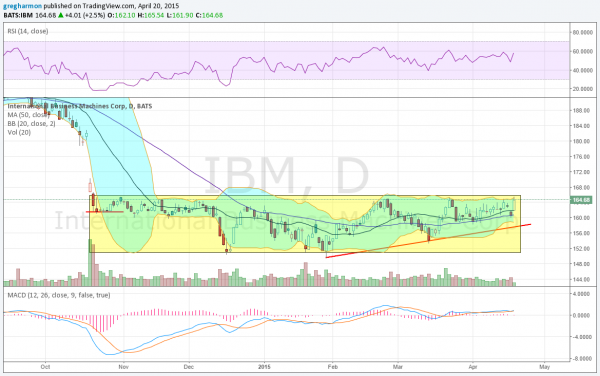
IBM crapped the bed following its earnings report in October and has not cleaned it up yet. The last 6 months has been a tight consolidation between 150 and 165, with the price action since January showing a series of higher lows. Some promise. A break higher now would give a target of 180 on a break of the ascending triangle higher over 165. Heading into earnings it is testing the top of the channel and horizontal resistance at 165 with the RSI pushing into the bullish range, while the MACD is turning higher. There is support lower at 159 and 154 followed by 150. There is resistance above at 165 and 170 followed by 178.67 and a gap fill to 180. The reaction to the last 6 earnings reports has been a move of about 3.83% on average or $6.35 making for an expected range of 158.75 to 171.50. The at-the money weekly April Straddles suggest a similar $6.15 move by Expiry with Implied Volatility at 40% above the May at 22%. Short interest is moderate at 2.8%. Open interest is big at the 165 Strike and below at the 160 Strike, but big enough from 152.5 to 175 that it may not influence it this week.
Trade Idea 1: Buy the April 167.5/170 Call Spread for 80 cents.
Trade Idea 2: Buy the April 167.5/170-172.5 1×2 Call Spread for $0.10.
Trade Idea 3: Buy the April 167.5/170/172.5 Call Butterfly for $0.40.
Trade Idea 4: Buy the May 167.5/177.5 Call Spread ($2.30) and sell the May 160 Put ($2.30 credit) for free.
#1, #2 and #3 give the short term upside, with #2 using margin. #4 gives the longer term upside and uses leverage to lower the cost, with risk at 160, back in the box at the 50 day SMA. I prefer #3 or #4.
Under Armour,
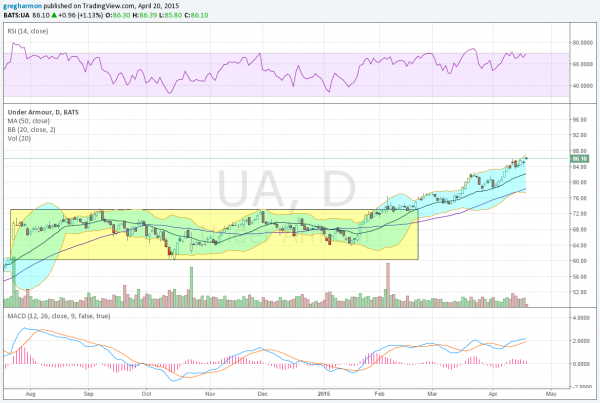
Under Armour, broke a long consolidation higher in February and has been trending higher since. The RSI is bullish and the MACD going up as well. There is support lower at 83 and 78.35 followed by 74.50 and 73. There is no resistance higher over today’s all time high at 86.39. The reaction to the last 6 earnings reports has been a move of about 7.97% on average or $6.90 making for an expected range of 79.25 to 93. The at-the money weekly April Straddles suggest a smaller $5.75 move by Expiry with Implied Volatility at 72% above the May at 37%. Short interest is elevated at 6.8%. Open interest very large at the 90 Strike above in April.
Trade Idea 1: Buy the April 86.5/90 Call Spread for $1.50
Trade Idea 2: Buy the April 87/90 1×2 Call Spread for a 5 cent credit.
Trade Idea 3: Buy the April 87/90/93 Call Butterfly for $0.70.
Trade Idea 4: Buy the April 84/81.5 1×2 Put Spread for free.
Trade Idea 5: Buy the April/May 90 Call Calendar for $0.75
Trade Idea 6: Sell the April/May 80 Put Calendar for $0.55
#1, #2 and #3 look for a move higher but not above 90 by Friday. #4 gives downside side and a possible entry under 80. #5 gives the longer term upside and #6 adds leverage and protection against 80 this week. I like #2 or #3 paired with #4 best for a trade this week, and then #5 and #6 together longer term.
Disclaimer: The information in this blog post represents my own opinions and does not contain a recommendation for any particular security or investment. I or my affiliates may hold positions or other interests in securities mentioned in the Blog, please see my Disclaimer page for my full disclaimer.
